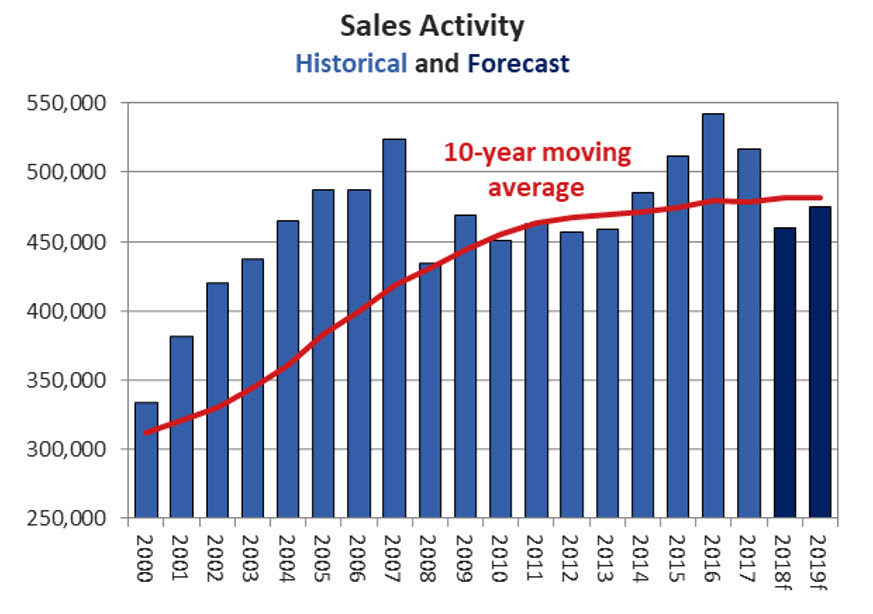
Canadian home sales at five-year low in May
Ottawa, ON, June 15, 2018 – Statistics released today by The Canadian Real Estate Association (CREA) show national home sales were little changed from April to May 2018.
Highlights:
- National home sales edged down 0.1% from April to May.
- Actual (not seasonally adjusted) activity was down 16.2% from May 2017.
- The number of newly listed homes rose 5.1% from April to May.
- The MLS® Home Price Index (HPI) in May was up 1% year-over-year (y-o-y).
- The national average sale price declined by 6.4% y-o-y in May.
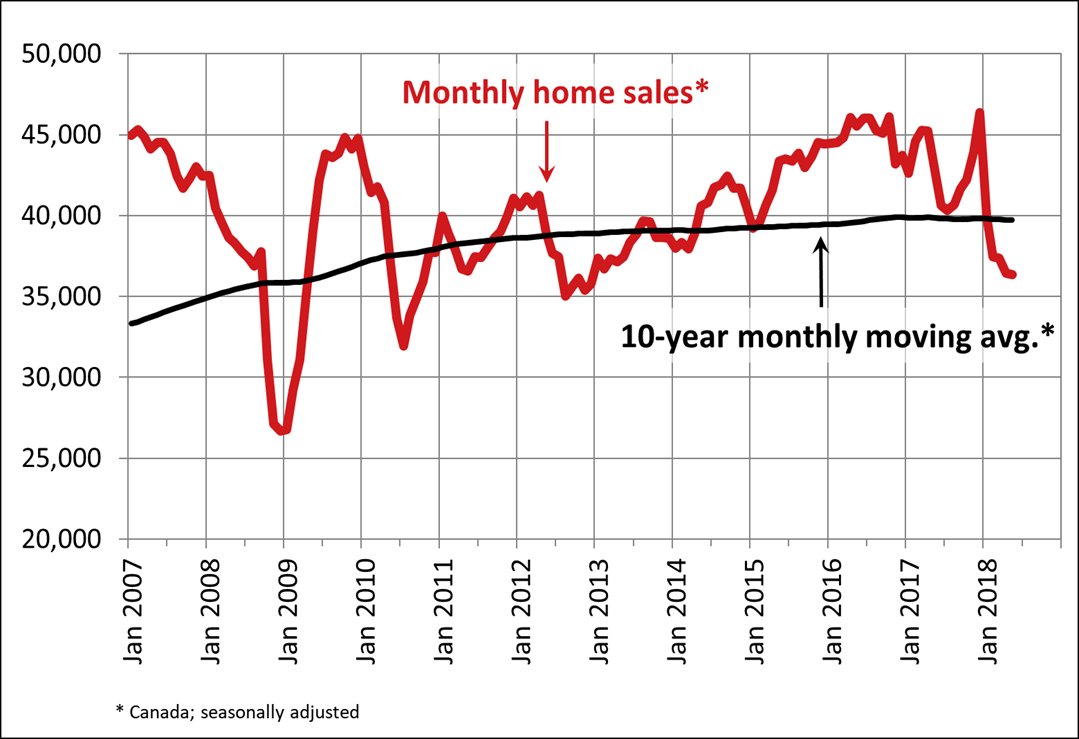
National home sales via Canadian MLS® Systems remained little changed in May 2018. Having edged 0.1% lower, it marked the lowest level for national sales activity in more than five years. (Chart A)
Slightly more than half of all local housing markets reported fewer sales in May compared to April, led by the Okanagan region, Chilliwack and the Fraser Valley, together with the Durham region of the Greater Toronto Area (GTA) and Quebec City. Declines in activity were offset by gains in Calgary, Thunder Bay, Brantford, London and St. Thomas, Oakville-Milton and the Quinte Region west of Kingston. A small increase in GTA sales also supported the national tally.
Actual (not seasonally adjusted) activity was down 16.2% compared to May 2017 and reached a seven-year low for the month. It also stood 5.5% below the 10-year average for the month of May. Activity came in below year-ago levels in about 80% of all local markets, led overwhelmingly by those in and around the Lower Mainland of British Columbia and the Greater Golden Horseshoe (GGH) region in Ontario.
“The stress-test that came into effect this year for homebuyers with more than a twenty percent down payment is continuing to suppress sales activity,” said CREA President Barb Sukkau. “The extent to which it is sidelining home buyers varies among housing markets and price ranges. All real estate is local, and REALTORS® remain your best source for information about sales and listings where you live or might like to in the future,” said Sukkau.
“This year’s new stress-test became even more restrictive in May, since the interest rate used to qualify mortgage applications rose early in the month,” said, Gregory Klump, CREA’s Chief Economist. “Movements in the stresstest interest rate are beyond the control of policy makers. Further increases in the rate could weigh on home sales activity at a time when Canadian economic growth is facing headwinds from U.S. trade policy frictions.”
The number of newly listed homes rose 5.1% in May but remained below year-ago levels. New listings rose in about three-quarters of all local markets, led by Edmonton, Calgary, Montreal, Quebec City, Ottawa and the GTA.
With new listings up and sales virtually unchanged, the national sales-to-new listings ratio eased to 50.6% in May compared to 53.2% in April and stayed within short reach of the long-term average of 53.4%.
A national sales-to-new listings ratio of between 40% and 60% is generally consistent with a balanced national housing market, with readings below and above this range indicating buyers’ and sellers’ markets respectively; however, the range consistent with balanced market conditions varies among local markets.
For that reason, considering the degree and duration that market balance readings are above or below their long-term average is a better way of gauging whether local housing market conditions favour buyers or sellers. Market balance measures that are within one standard deviation of their long-term average are generally consistent with balanced market conditions.
Based on a comparison of the sales-to-new listings ratio with its long-term average, about two-thirds of all local markets were in balanced market territory in May 2018.
The number of months of inventory is another important measure for the balance between housing supply and demand. It represents how long it would take to liquidate current inventories at the current rate of sales activity.
There were 5.7 months of inventory on a national basis at the end of May 2018. While this marks a three-year high for the measure, it remains near the long-term average of 5.2 months.
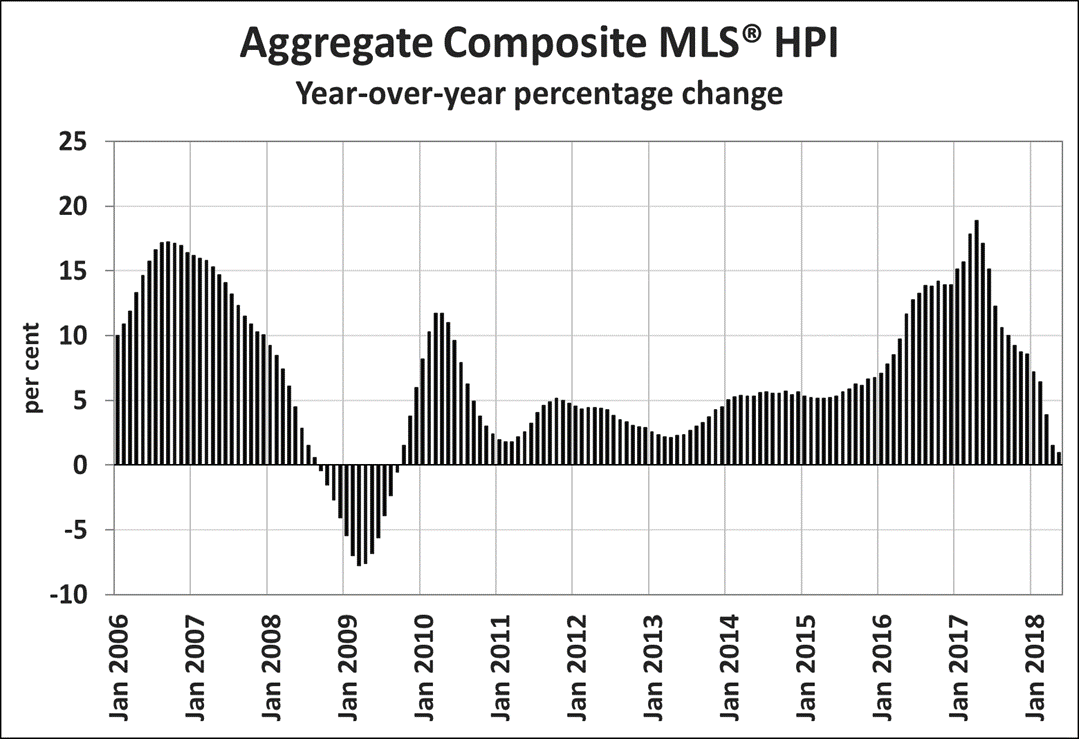
The Aggregate Composite MLS® HPI was up 1% y-o-y in May 2018, marking the 13th consecutive month of decelerating y-o-y gains. It was also the smallest y-o-y increase since September 2009. (Chart B)
Decelerating y-o-y home price gains largely reflect trends among Greater Golden Horseshoe (GGH) housing markets tracked by the index. While home prices in the region have stabilized and begun trending higher on a monthly basis, rapid price gains recorded one year ago have contributed to deteriorating y-o-y price comparisons. If recent trends remain intact, year-over-year comparisons will likely improve in the months ahead.
Apartment units again posted the largest y-o-y price gains in May (+12.7%), followed by townhouse/row units (+4.9%). By contrast, one-storey and two-storey single family home prices were down (-1.5% and -4.7% y-o-y respectively).
Benchmark home prices in May were up from year-ago levels in 8 of the 15 markets tracked by the index.
Composite benchmark home prices in the Lower Mainland of British Columbia continue to trend upward after having dipped briefly in the second half of 2016 (Greater Vancouver (GVA): +11.5% y-o-y; Fraser Valley: +20.6% y-o-y). Apartment and townhouse/row units have been largely driving this regional trend while single family home prices in the GVA have stabilized. In the Fraser Valley, single family home prices have also started rising.
Benchmark home prices were up by 11.5% on a y-o-y basis in Victoria and by 18.1% elsewhere on Vancouver Island.
Within the GGH region, price gains have slowed considerably on a y-o-y basis but remain above year-ago levels in Guelph (+3.8%). By contrast, home prices in the GTA, Oakville-Milton and Barrie were down from where they stood one year earlier (GTA: -5.4% y-o-y; Oakville-Milton: -5.9% y-o-y; Barrie and District: -6.3% y-o-y). This reflects rapid price growth recorded one year ago and masks recent month-over-month price gains in these markets.
Calgary and Edmonton benchmark home prices were down slightly on a y-o-y basis in May (Calgary: -0.5% y-o-y; Edmonton: -0.9% y-o-y), while prices in Regina and Saskatoon were down more noticeably from year-ago levels (-6.2% y-o-y and -2.7% y-o-y, respectively).
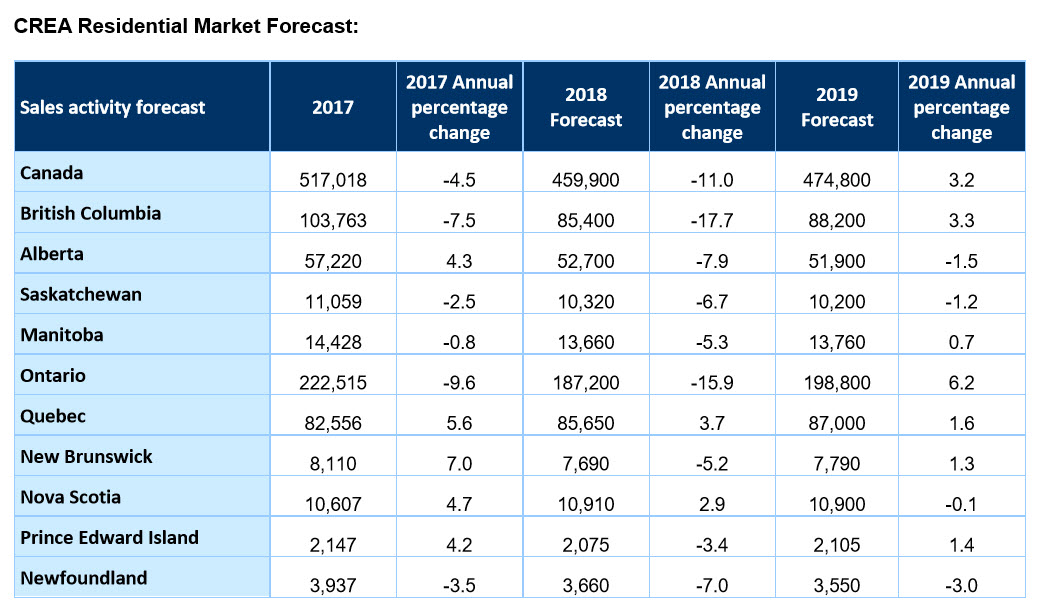
Benchmark home prices rose by 8.2% y-o-y in Ottawa (led by a 9.5% increase in two-storey single family home prices), by 6.7% in Greater Montreal (led by a 7.3% increase in two-storey single family home prices) and by 4.3% in Greater Moncton (led by a 4.8% increase in townhouse/row unit prices). (Table 1)
The MLS® Home Price Index (MLS® HPI) provides the best way of gauging price trends because average price trends are strongly distorted by changes in the mix of sales activity from one month to the next.
The actual (not seasonally adjusted) national average price for homes sold in May 2018 was just over $496,000, down 6.4% from one year earlier.
The national average price is heavily skewed by sales in the GVA and GTA, two of Canada’s most active and expensive markets. Excluding these two markets from calculations cuts more than $104,000 from the national average price to just over $391,100 and trims the y-o-y decline to 2%.
– 30 –
PLEASE NOTE: The information contained in this news release combines both major market and national sales information from MLS® Systems from the previous month.
CREA cautions that average price information can be useful in establishing trends over time, but does not indicate actual prices in centres comprised of widely divergent neighbourhoods or account for price differential between geographic areas. Statistical information contained in this report includes all housing types.
MLS® Systems are co-operative marketing systems used only by Canada’s real estate Boards to ensure maximum exposure of properties listed for sale.
The Canadian Real Estate Association (CREA) is one of Canada’s largest single-industry trade associations. CREA works on behalf of more than 125,000 REALTORS® who contribute to the economic and social well-being of communities across Canada. Together they advocate for property owners, buyers and sellers.
Further information can be found at http://crea.ca/statistics.
For more information, please contact:
Pierre Leduc, Media Relations
The Canadian Real Estate Association
Tel.: 613-237-7111 or 613-884-1460
E-mail: [email protected]