CREA Updates Resale Housing Market Forecast
Ottawa, ON, June 15, 2018 – The Canadian Real Estate Association (CREA) has updated its forecast for home sales activity via the Multiple Listing Service® (MLS®) Systems of Canadian real estate Boards and Associations in 2018 and 2019.
Housing market fundamentals remain strong in many parts of the country. Nonetheless, many housing markets continue to struggle in the face of policy headwinds.
The new mortgage stress test announced last October had been expected to cause homebuyers to rush purchases in advance of the new rules coming into effect in January and for the “pull-forward” of sales activity to result in fewer transactions in the first half of 2018.
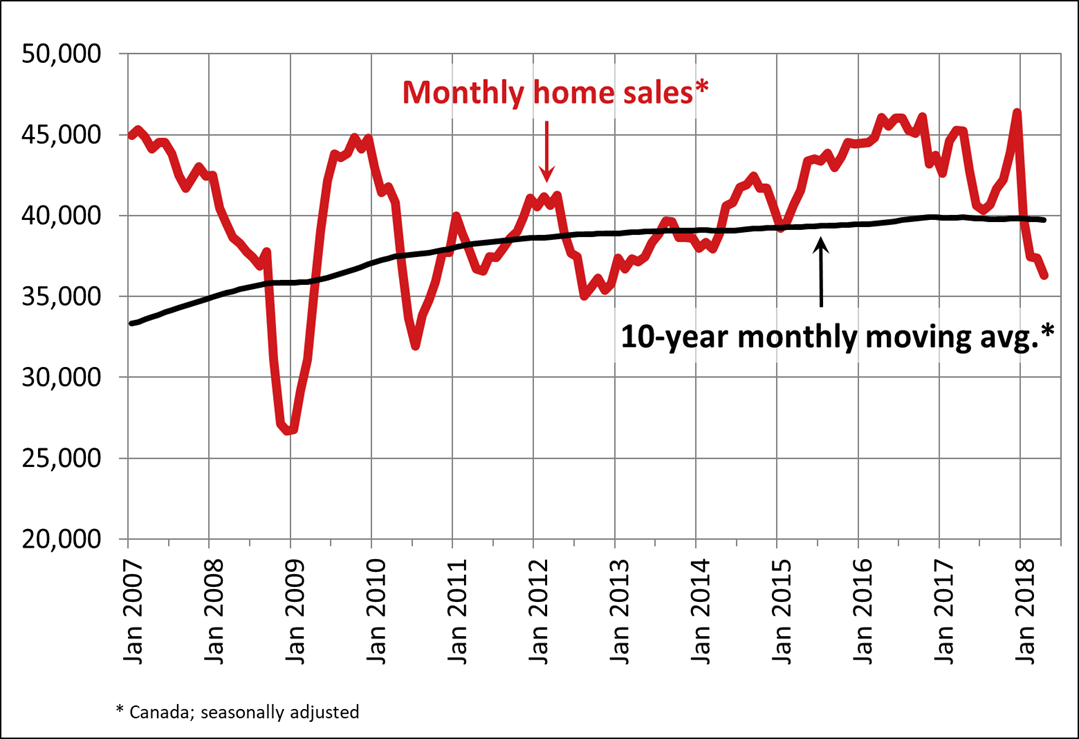
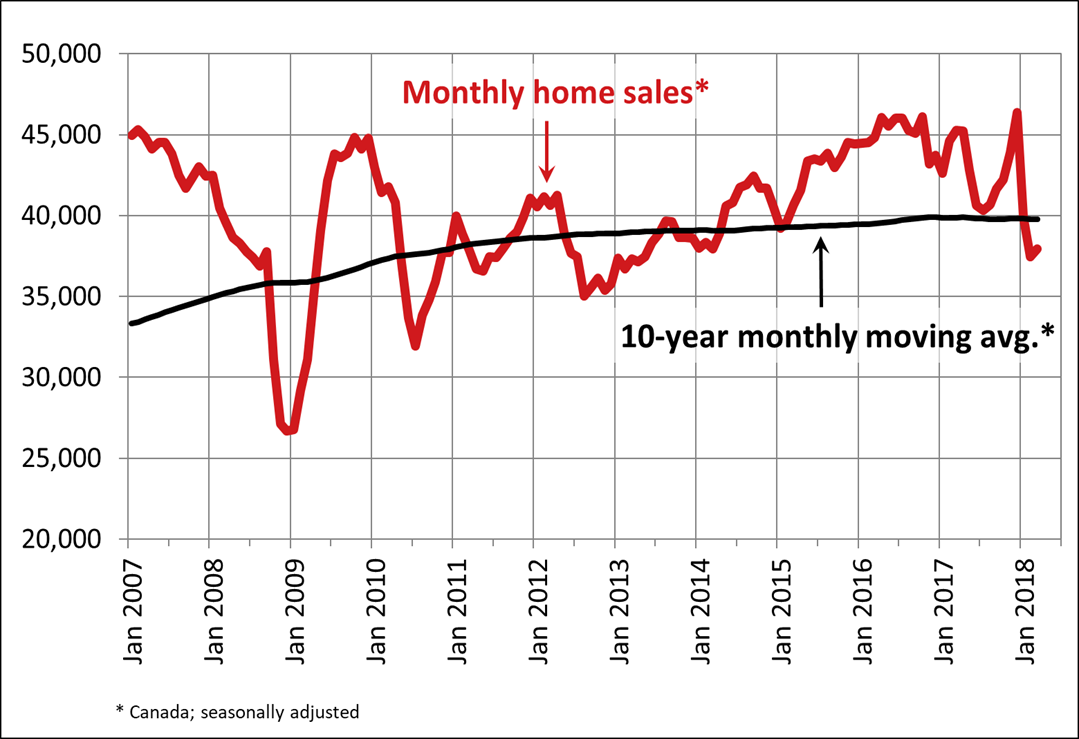
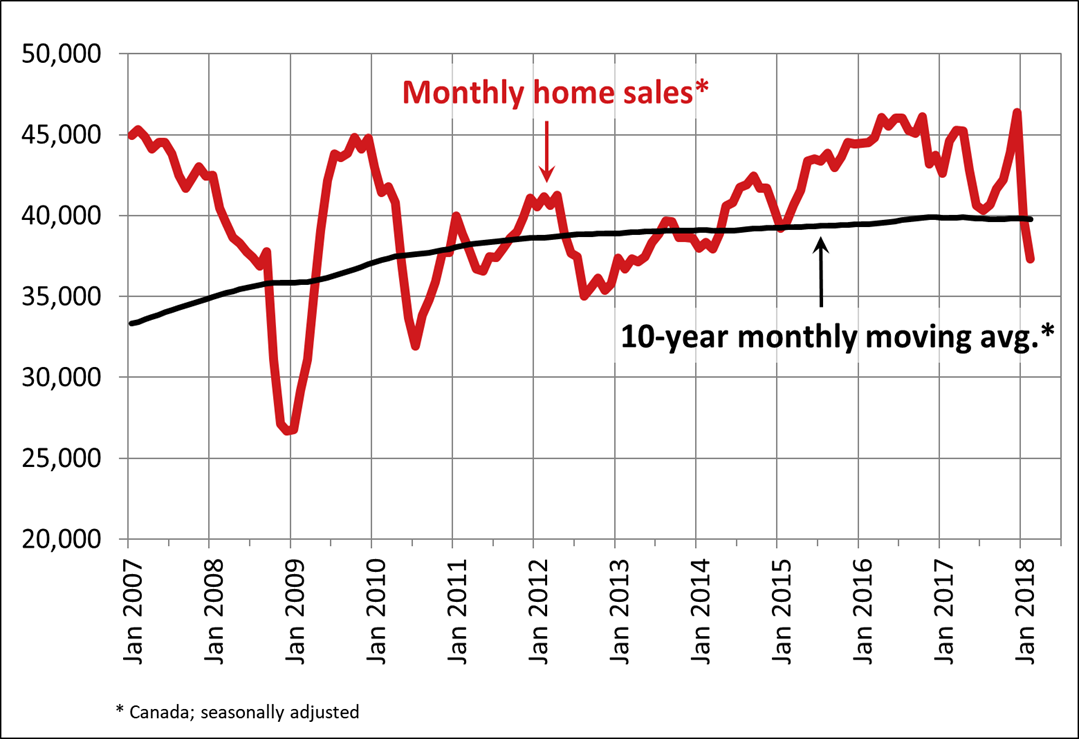
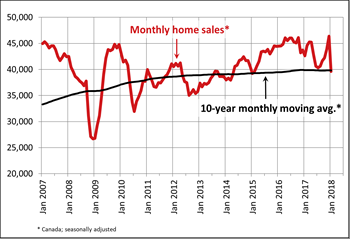
Evidence suggests the policy response was stronger than expected, with seasonally adjusted national home sales last December having surged to the highest level ever recorded before dropping sharply in early 2018.
Actual (not seasonally adjusted) national sales figures for March, April and May are typically among the most active months in any given year. Combined sales fell to a nine-year low for the three-month period. The seasonally adjusted trend suggests sales momentum has not yet begun to rally.
Interest rates are widely expected to rise further this year and next. Home sales activity is nonetheless still expected to strengthen modestly in the second half of 2018 as housing market uncertainty diminishes.
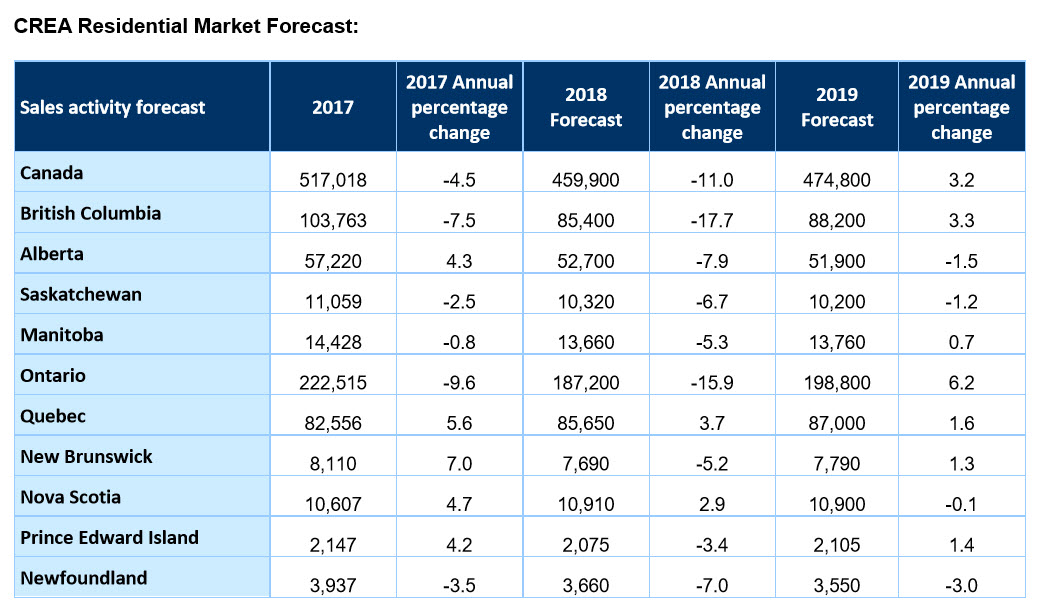
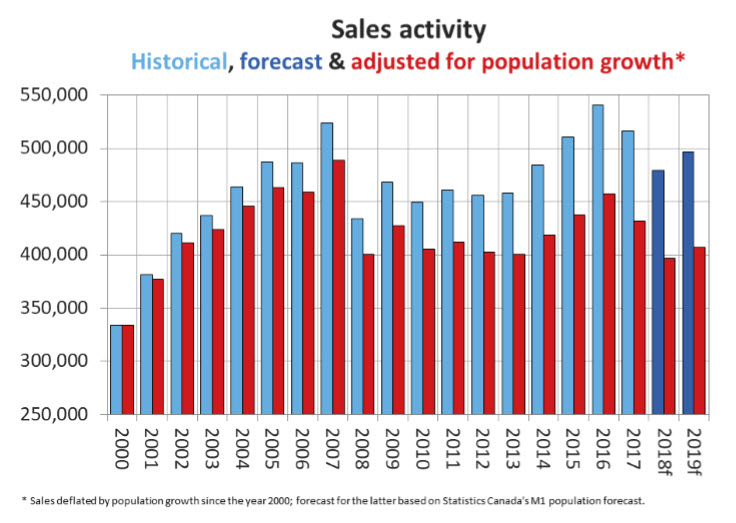
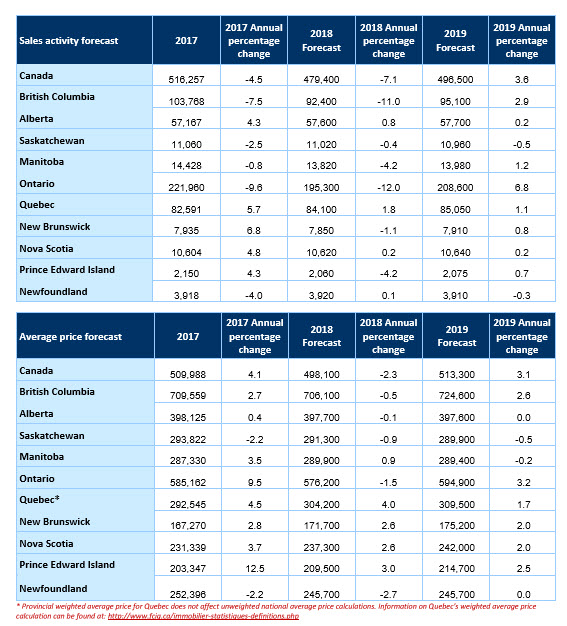
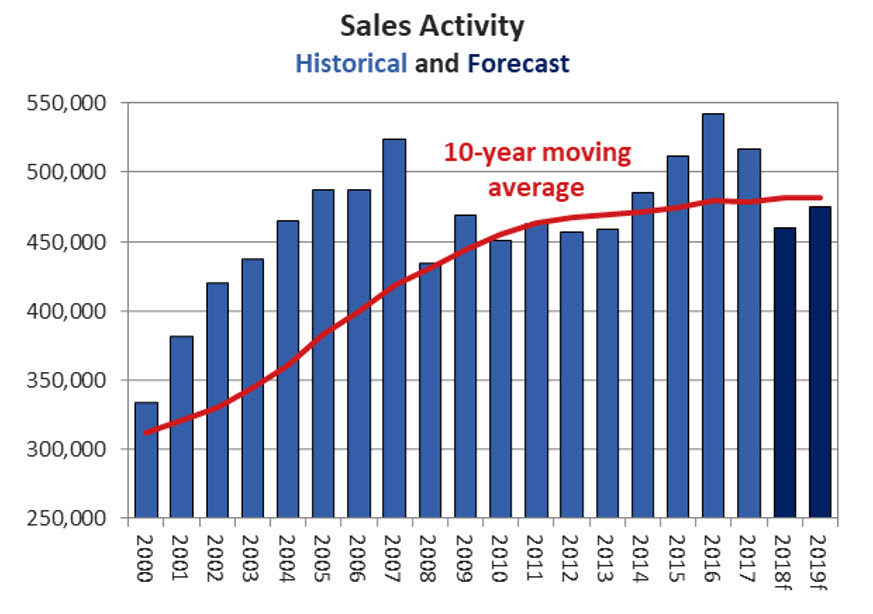
Taking these factors into account, the national sales forecast has been revised downward and is now projected to decline by 11% to 459,900 units this year. The decrease almost entirely reflects weaker sales in B.C. and Ontario amid heightened housing market uncertainty, provincial policy measures, high home prices, ongoing supply shortages and this year’s new mortgage stress test.
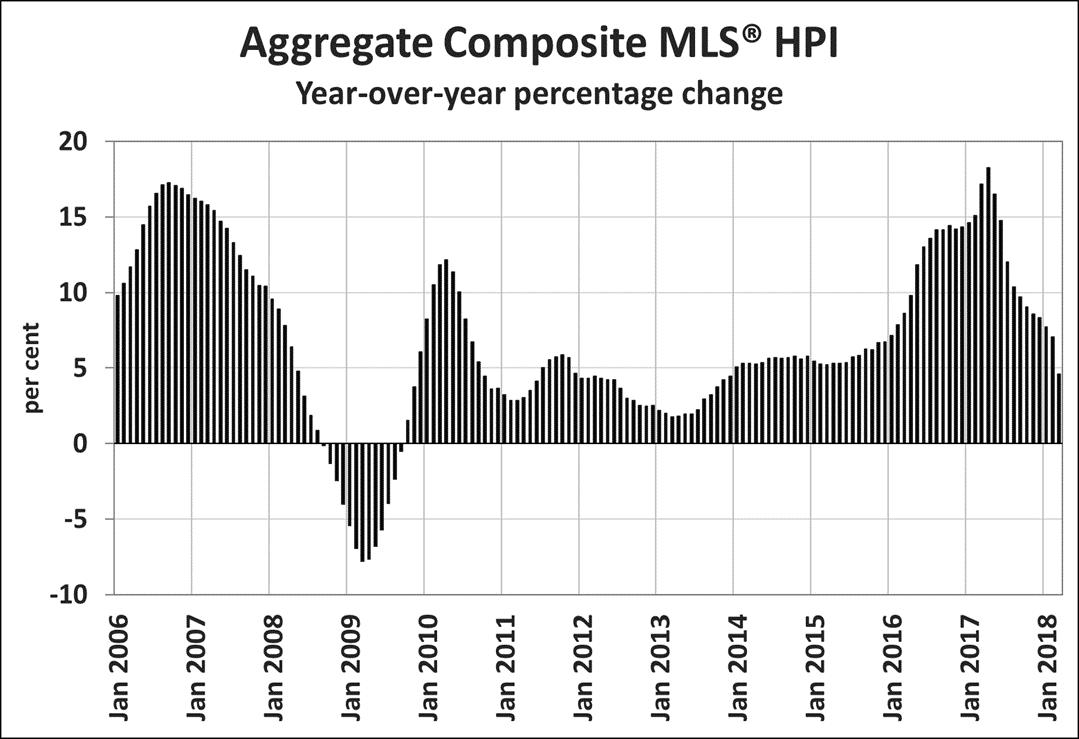
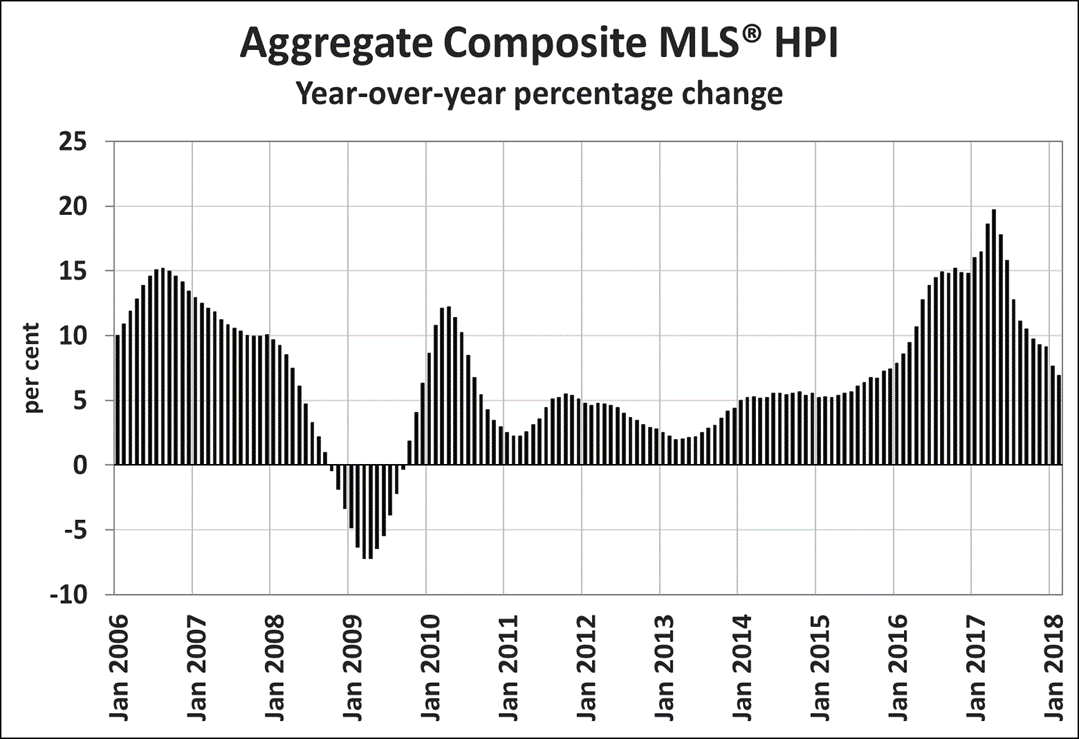
The national average price is projected to ease to $499,100 this year. This is little changed from CREA’s previous forecast and a decline of 2.1% from 2017. Only Newfoundland and Labrador’s average price is expected to post a decline of that size, while more than half of all provinces are forecast to see increases. The national average price reduction reflects fewer transactions in B.C. and Ontario.
The average price decline forecasted for Ontario (-1.7%) largely reflects fewer higher-priced home sales in Toronto, particularly during the important spring market which usually sees a seasonal jump in the average price but which failed to materialize this year. While this seasonal pattern is expected to resume in 2019, the boost to the annual figure from the spring surge has been absent this year.
Meanwhile, home prices in Eastern Ontario, Quebec, New Brunswick, Nova Scotia and Prince Edward Island are expected to continue rising following steadily firming market conditions in recent years. British Columbia is also now forecast to see its average price rise in 2018, as prices in the province have been more resilient than previously expected.
Home prices are forecast to edge down by 1% in Alberta, by 1.5% in Saskatchewan and by 2.9% in Newfoundland and Labrador. In the latter two provinces, supply remains historically elevated in relation to demand.
In 2019, national sales are forecast to rebound modestly to 474,800 units but remain below annual levels recorded in 2014 through 2017. The anticipated partial recovery in sales over the second half of 2018 from deferred purchases over the first half of the year in Ontario and B.C. is subsequently expected to fade over 2019 as interest rates continue to rise. This trend is also predicted to occur in other provinces but be most pronounced in B.C. and Ontario, where transactions have fallen sharply over the first half of 2018 despite a supportive economic and demographic backdrop for housing demand.
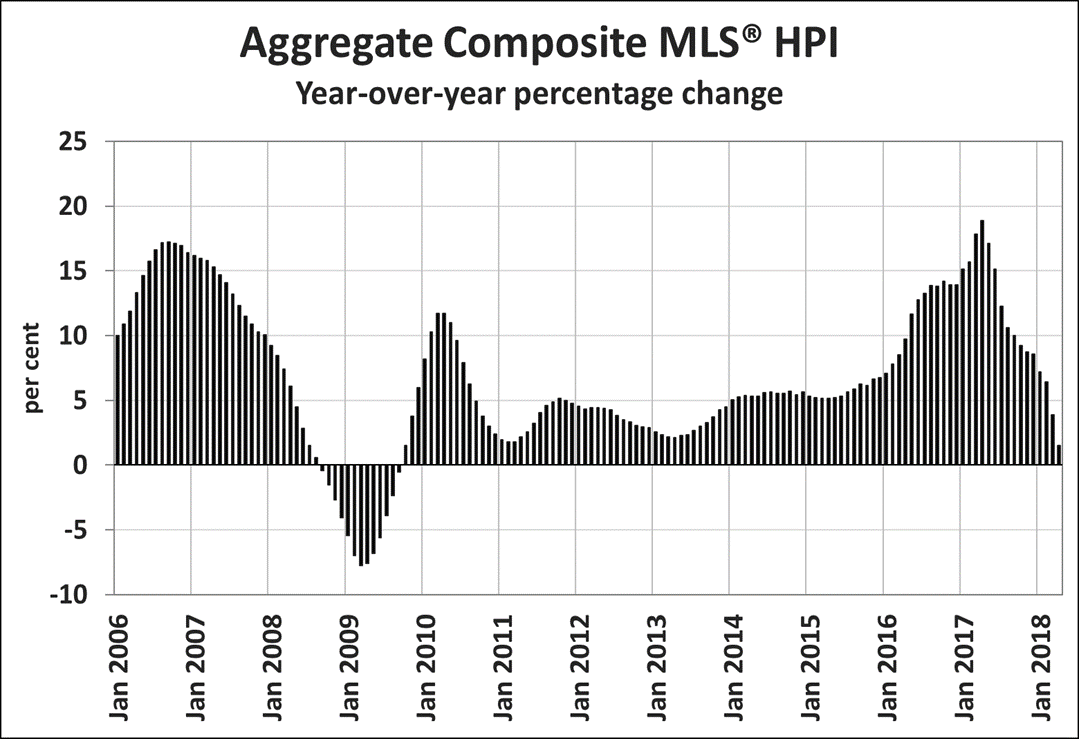
The national average price is also forecast to rebound by 3.8% to $518,300 in 2019, reflecting an expected return to normal seasonal patterns for spring sales activity and prices in Ontario housing markets. Indeed, the MLS® Home Price Index is rising among urban centres in B.C. and Ontario.
Market balance is continuing to firm in Quebec, New Brunswick, Nova Scotia and Prince Edward Island. Further modest price increases in these provinces are forecast in 2019, with price gains held in check by rising interest rates. Meanwhile, prices in Alberta, Saskatchewan, Manitoba and Newfoundland and Labrador are forecast to remain stable from 2018 to 2019.
– 30 –
About The Canadian Real Estate Association
The Canadian Real Estate Association (CREA) is one of Canada’s largest single-industry trade associations. CREA works on behalf of more than 125,000 REALTORS® who contribute to the economic and social well-being of communities across Canada. Together they advocate for property owners, buyers and sellers.
For more information, please contact:
Pierre Leduc, Media Relations
The Canadian Real Estate Association
Tel.: 613-237-7111 or 613-884-1460
E-mail: [email protected]