Episode 3:REALTORS® and the Timeless Currency of Trust

In Episode 3 of REAL TIME, we talk with Steve Murray, president and co-founder of REAL Trends, about the foundational elements of real estate – what’s changed, what hasn’t – and how trust and communication continue to play a vital role in safeguarding REALTOR® success.

Episode 2:Chris Chopik – Real Estate and the Environment

In celebration of Earth Day we’ll speak with REALTOR® Chris Chopik, a passionate environmental advocate about how climate-risk directly impacts the industry, the role REALTORS® can play protecting the environment, and what REALTORS® need to know about selling greener homes.

Episode 1:Terry O’Reilly – REALTORS® and the Importance of Emotional Connections

This podcast is about brand storytelling. We’ll explore the crucial connection between REALTORS® and the emotional aspects of home buying and how to use those key elements to add value to your client relationships and the sales process.

Episode 1: Terry O’Reilly

Buying or selling a home isn’t just a financial decision. It’s an emotional one. In our inaugural episode of REAL TIME, we chat with award-winning marketer and radio icon Terry O’Reilly about the changing landscape of real estate—and how brand storytelling, innovation, and emotional connections can boost your business as a REALTOR®.

Bank of Canada announces emergency interest rate cut

In an emergency announcement on March 13th, 2020 the Bank of Canada announced a 0.5% reduction in its trend-setting overnight lending rate from 1.25% to 0.75%. This was a further reduction from the 0.5% cut announced just 9 days earlier at the regularly scheduled interest rate announcement.

The announcement was part of coordinated action by the Department of Finance, the Bank of Canada and the Office of the Superintendent of Financial Institutions, intended to maintain the flow of funding to Canadian financial institutions in order for them to extend funds to businesses and consumers as needed.

In a follow up press release the Bank of Canada explained, “The macroeconomic situation is evolving very rapidly as the COVID-19 coronavirus spreads around the world” and although the longer-term implications of the virus were difficult to assess it clearly presented a downside risk to the economy.

In addition to the impacts of the coronavirus, the steep drop in oil prices earlier in the week poses an ongoing hurdle to Canadian economic productivity.

As of March 17th, the benchmark five-year lending rate was still 5.19%, where it has remained since being trimmed in July 2019 by a quarter of a percentage point. However, that will likely fall later this week when new data is released. All mortgage applicants must qualify for financing based on an interest rate no less than the benchmark five-year lending rate, even if the mortgage is for less than five years.

Canada’s major chartered banks are currently advertising five-year fixed mortgage interest rates of around 2.59%. Home buyers can often negotiate the interest rate for mortgage financing based on their creditworthiness and the degree to which they do other banking business with the mortgage lender.

The Government and Bank of Canada will continue to announce updated stimulus measures over the coming weeks as the economic impacts of these changes unfold. The Bank specifically stated that it stands ready to adjust monetary policy further.

< Back to Newsroom

Canadian home sales up in February

As providers of the most accurate and timely housing data and statistics, CREA cannot credibly
update its quarterly forecast at this time.

Ottawa, ON, March 16, 2020 – Statistics released today by the Canadian Real Estate Association (CREA) show national home sales were up between January and February 2020.

Highlights:

  • National home sales climbed 5.9% on a month-over-month (m-o-m) basis in February.
  • Actual (not seasonally adjusted) activity was up 26.9% year-over-year (y-o-y).
  • The number of newly listed properties jumped 7.3% m-o-m.
  • The MLS® Home Price Index (HPI) advanced by 0.7% m-o-m and 5.9% y-o-y.
  • The actual (not seasonally adjusted) national average sale price climbed 15.2% y-o-y.

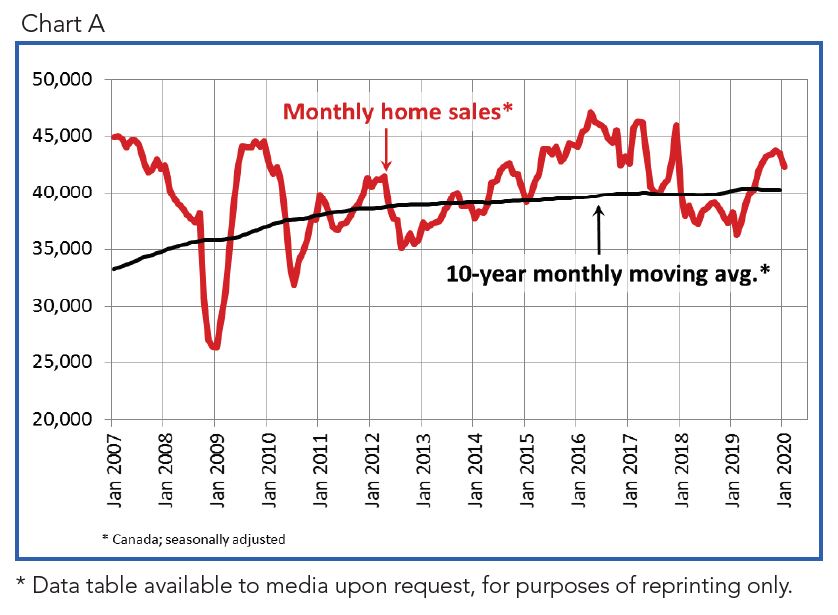
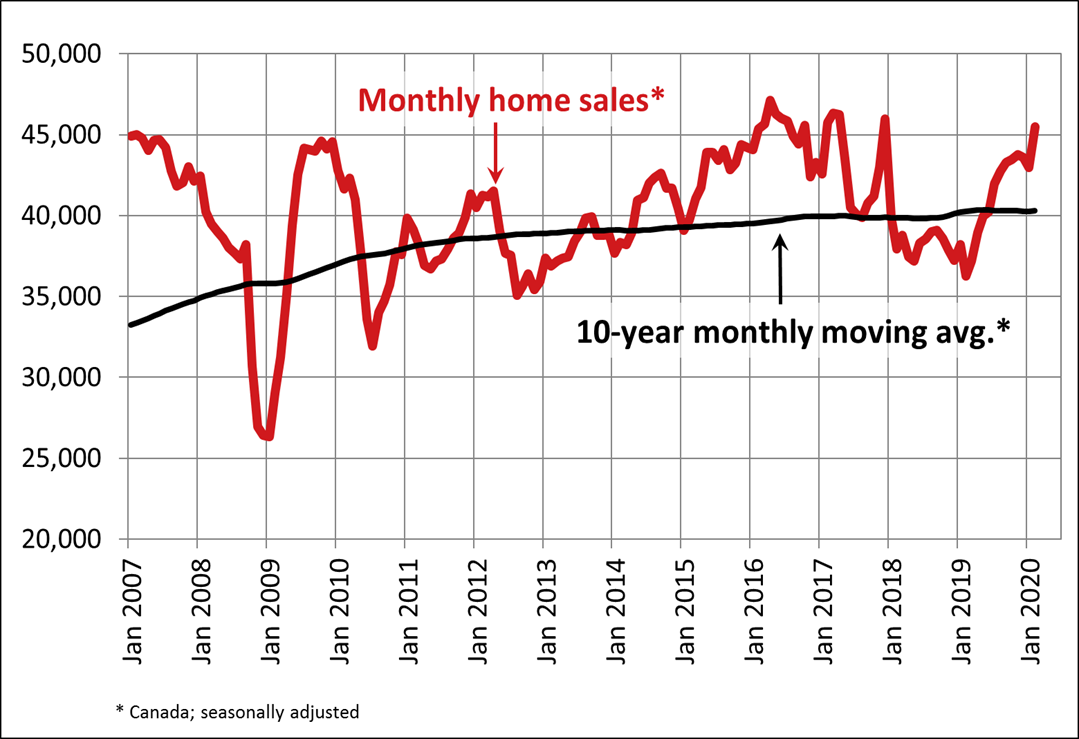
Home sales recorded over Canadian MLS® Systems rose by 5.9% in February 2020, marking one of the larger m-o-m gains of the past decade.

With transactions up in about 60% of all local markets in February, the big national increase was largely the result of a 15% jump in activity in the Greater Toronto Area (GTA). Many other Central and Southern Ontario markets also posted sizeable sales gains between January and February.

Actual (not seasonally adjusted) sales activity stood 26.9% above February 2019, although sales were quite weak a year ago. February 2019 marked a decade-low for the month, so a good part of the big y-o-y gain reflects low levels of activity recorded at the time. February 2020 also benefited from an additional day due to the leap year.

Transactions surpassed year-ago levels in about 80% of all local markets, including all large urban markets.

“Home prices are accelerating in markets where listings are in increasingly short supply, specifically in Ontario, Quebec and the Maritimes which together account for about two-thirds of national sales activity,” said Jason Stephen, president of CREA. “Meanwhile, ample supply across the Prairies and in Newfoundland and Labrador means increased competition among sellers. Whether you are looking to buy or sell, or both, all real estate is local, and nobody knows that better than a professional REALTOR®, your best source for information and guidance when negotiating the sale or purchase of a home,” said Stephen.

“Following a quieter than normal December/January period, February saw a burst of new listings in some of Canada’s most supply-starved markets, so it was not a surprise that sales were up alongside that increase in new supply,” said Shaun Cathcart, CREA’s Senior Economist. “There is some question about how much pent-up demand remains in parts of the country where listings have been low for some time now. That said, it will take more than one month of increased new listings to even start to turn some of these markets towards some semblance of balance. In the meantime, expect competition among buyers for available listings to continue to drive prices higher.”

The number of newly listed homes jumped 7.3% in February compared to January, more than erasing the declines of late last year. New supply gains were posted in a number of large markets, including the Fraser Valley, Calgary, Edmonton, the GTA, Hamilton-Burlington, Kitchener-Waterloo, Windsor-Essex, Ottawa and Montreal.

With new listings rising by slightly more than sales in February, the national sales-to-new listings ratio fell back to 64% compared to 64.9% posted in January. That said, the bigger picture is that this measure of market balance has been significantly above its long-term average of 53.8% for the last five months. Barring an unforeseen change in these recent trends, home prices appear poised to post further growth in 2020.

Considering the degree and duration to which market balance readings are above or below their long-term averages is the best way of gauging whether local housing market conditions favour buyers or sellers. Market balance measures that are within one standard deviation of their long-term average are generally consistent with balanced market conditions.

Based on a comparison of the sales-to-new listings ratio with the long-term average, about 60% of all local markets were in balanced market territory in February 2020. Apart from a few areas of Alberta and Saskatchewan, the remainder were all favouring sellers.

The number of months of inventory is another important measure of the balance between sales and the supply of listings. It represents how long it would take to liquidate current inventories at the current rate of sales activity.

There were 4.1 months of inventory on a national basis at the end of February 2020 – the lowest level since the summer of 2007. This measure of market balance is now more than a full month below its long-term average of 5.2 months, suggesting sales negotiations are becoming increasingly tilted in favour of sellers.

National measures of market balance continue to mask significant and increasing regional variations. The number of months of inventory has swollen far beyond long-term averages in the Prairie provinces

and Newfoundland & Labrador, giving homebuyers ample choice in these regions. By contrast, the measure is running well below long-term averages in Ontario, Quebec and the Maritime provinces,

resulting in increased competition among buyers for listings and providing fertile ground for price gains. The measure remains in balanced territory in British Columbia.

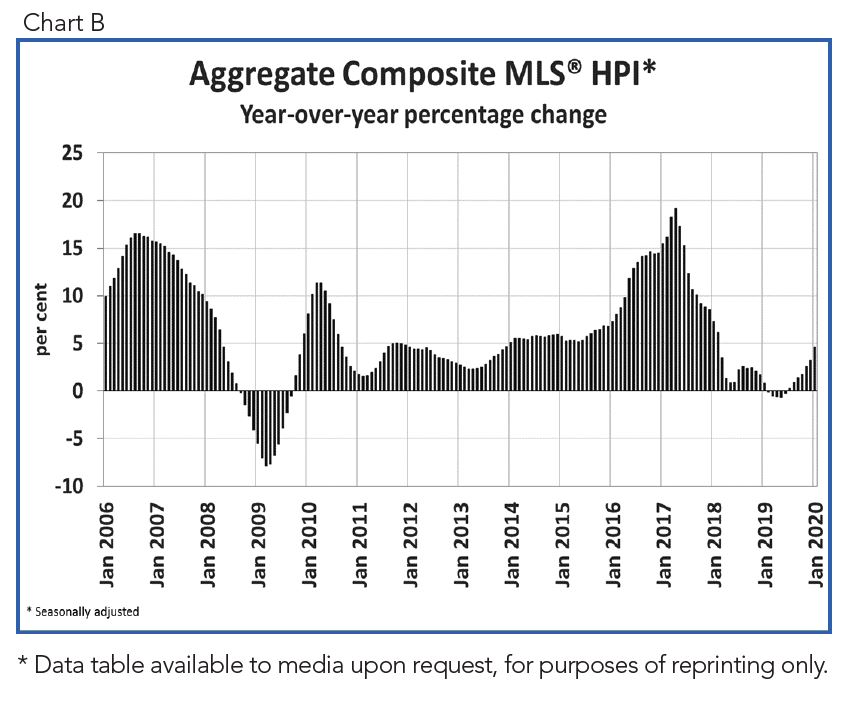
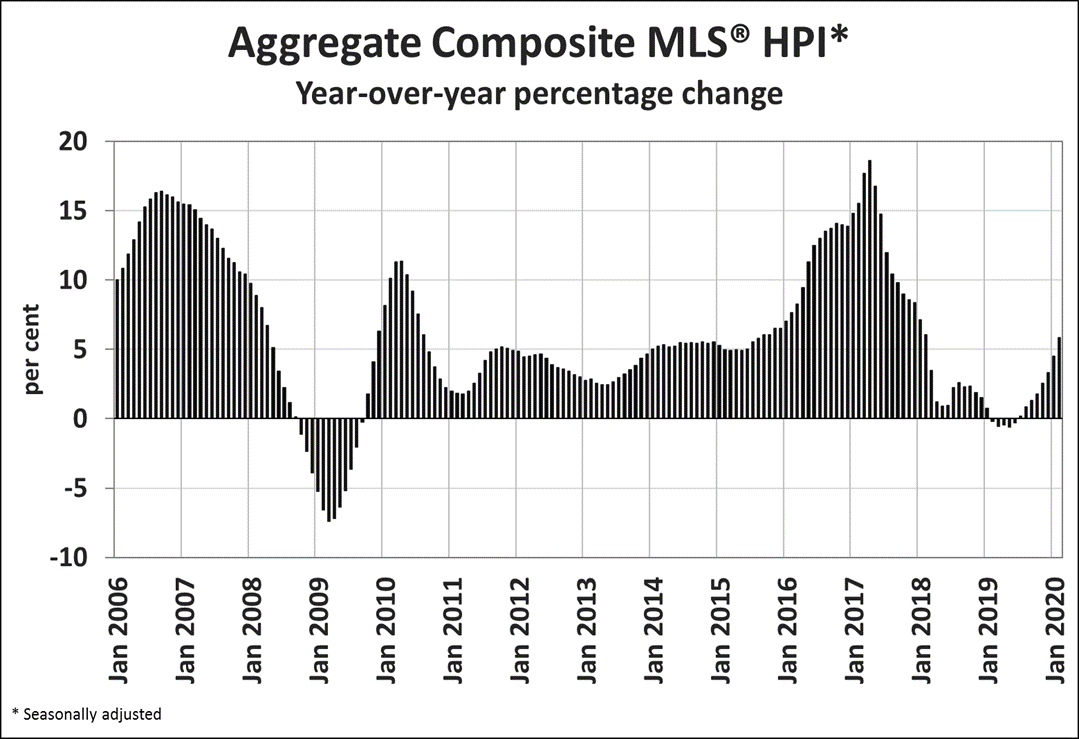
The Aggregate Composite MLS® Home Price Index (MLS® HPI) rose 0.7% in February 2020 compared to January, marking its ninth consecutive monthly gain.

The MLS® HPI was up in February 2020 compared to the previous month in 15 of the 19 markets tracked by the index. As of this release, Winnipeg is in the MLS® HPI.

Looking at the big Prairie markets, home price trends have ticked downwards in Calgary and Edmonton to start 2020 but have generally been stable since the beginning of last year. Prices in Saskatoon have also been stable over the last year, while those in Regina have continued to trend lower. Prices in Winnipeg have been on a slow upward trend since the beginning of 2019.

Meanwhile, the recovery in home prices remains in full swing in British Columbia and in Ontario’s Greater Golden Horseshoe (GGH) region. Further east, price growth in Ottawa, Montreal and Moncton continues as it has for some time now, with Ottawa and Montreal prices accelerating to start 2020.

Comparing home prices to year-ago levels yields considerable variations across the country, although for the most part trends are still regionally split along east/west lines, with rising gains from Ontario east, and a mixed bag of smaller gains and declines in B.C. and the Prairies.

The actual (not seasonally adjusted) Aggregate Composite MLS® HPI rose 5.9% y-o-y, the biggest year-over-year gain since February 2018.

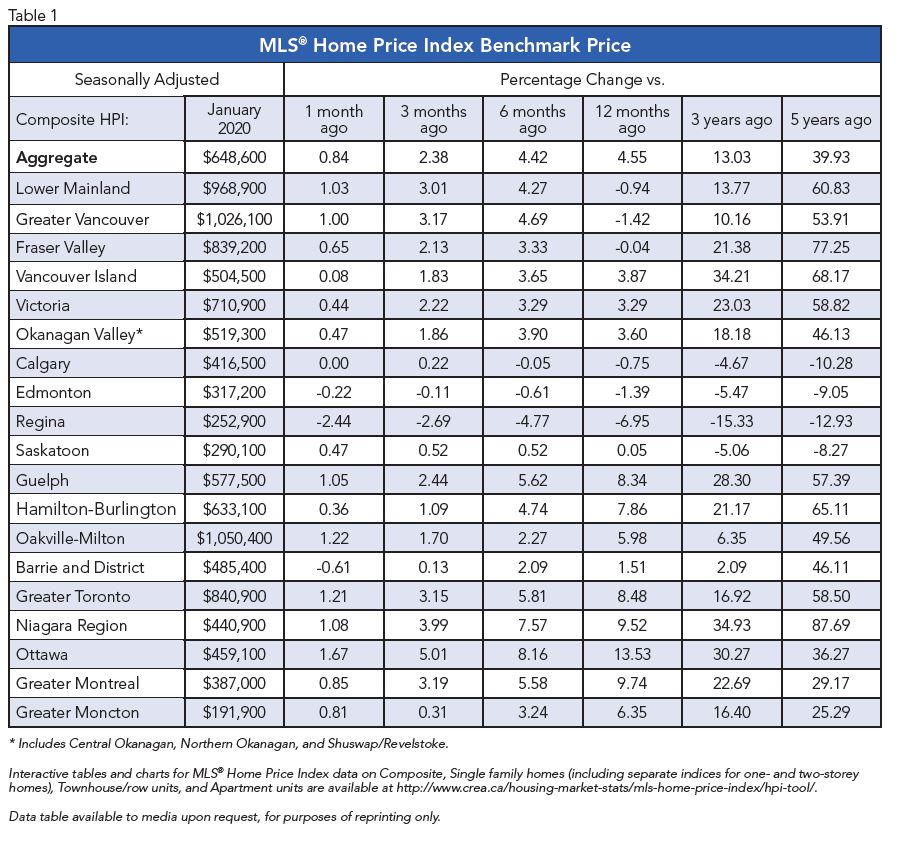
Prices are now back in positive y-o-y territory in both Greater Vancouver (+0.3%) and the Fraser Valley (+1.4%). Elsewhere in British Columbia, home prices logged y-o-y increases in the Okanagan Valley (+3.9%), Victoria (+4.3%) and elsewhere on Vancouver Island (+3.2%).

Calgary and Edmonton continued to post small y-o-y price declines, while the y-o-y gap was -5.4% in Regina. Prices in Saskatoon (+1.1%) and Winnipeg (+1.6%) both posted a small y-o-y increases in February.

In Ontario, home price growth has re-accelerated across the GGH, with a number of markets posting double-digit growth as of February. Meanwhile, price gains in recent years have continued uninterrupted in Ottawa (+14.7%), Montreal (+10.4%) and Moncton (+7.5%).

All benchmark home categories tracked by the index accelerated further into positive territory on a y-o-y basis, with similar sized gains among the different property types.

Two-storey single family homes posted the biggest y-o-y increase (+6.2%) followed closely by prices for apartment units (+6%), one-storey single-family homes (+5.4%) and townhouse/row units (+5.1%).

The MLS® HPI provides the best way to gauge price trends because averages are strongly distorted by changes in the mix of sales activity from one month to the next.

The actual (not seasonally adjusted) national average price for homes sold in February 2020 was around $540,000, up 15.2% from the same month the previous year.

The national average price is heavily influenced by sales in the GVA and GTA, two of Canada’s most active and expensive housing markets. Excluding these two markets from calculations cuts close to $130,000 from the national average price, trimming it to around $410,000.

– 30 –

PLEASE NOTE: The information contained in this news release combines both major market and national sales information from MLS® Systems from the previous month.

CREA cautions that average price information can be useful in establishing trends over time, but does not indicate actual prices in centres comprised of widely divergent neighbourhoods or account for price differential between geographic areas. Statistical information contained in this report includes all housing types.

MLS® Systems are co-operative marketing systems used only by Canada’s real estate Boards to ensure maximum exposure of properties listed for sale.

The Canadian Real Estate Association (CREA) is one of Canada’s largest single-industry associations, representing more than 130,000 REALTORS® working through 90 real estate boards and associations.

Further information can be found at http://crea.ca/statistics.

For more information, please contact:
Pierre Leduc, Media Relations
The Canadian Real Estate Association
Tel.: 613-237-7111 or 613-884-1460
E-mail: [email protected]

< Back to Newsroom

Bank of Canada cuts interest rates in response to rising global economic risks

Update: The Bank of Canada today lowered its target for the overnight lending rate by a further 50 basis points to 0.75% in an unscheduled rate cut.

In a joint announcement with the Minister of Finance and the Superintendent of Financial Institutions, the Bank cited recent negative shocks to the Canadian economy due to the COVID-19 pandemic along with the sharp drop in oil prices as severe sources of instability which required coordinated action. The Bank also stated that “they stand ready to adjust monetary policy further if required to support economic growth and keep inflation on target” during this period of economic stress.

In line with financial market expectations, the Bank of Canada announced, on March 4, it was lowering its trend-setting overnight lending rate by 50 basis points from 1.75% to 1.25%. This was the first change in the overnight lending rate since October 2018.

This follows a day after the U.S. Federal Reserve cut the Federal Funds rate by 50 basis points in an emergency session—part of a coordinated effort by global monetary and fiscal authorities to provide support to the global economy.

The reason for the move was largely due to increasing risks of major supply chain disruptions resulting from the COVID-19 virus. According to the announcement, COVID-19, and efforts to contain the virus, are likely to cause business activity to decline. The virus has already caused a decline in global commodity prices, consequently lowering the value of Canadian exports which has knock-on effects for the rest of the economy.

In addition to the global risks associated with COVID-19, the Bank also cited several domestic factors holding back the economy, including rail line blockades, the Ontario teachers strikes, and winter storms.

The combination of these factors has caused the Bank’s outlook for the Canadian economy to deteriorate compared with their outlook in the January Monetary Policy Report.

As these risks evolve, the Bank has stated it “stands ready to adjust monetary policy further if required to support economic growth and keep inflation on target.”

This decline in interest rates, along with recent policy changes announced by the Department of Finance, represents an easing of financial conditions for the housing market. However, this could be counter-balanced by the potential for lower income growth and disruptions to economic activity.

On March 4, the benchmark five-year lending rate was still 5.19%, where it has remained since being trimmed in July 2019 by a quarter of a percentage point. All mortgage applicants must qualify for financing based on an interest rate no less than the benchmark five-year lending rate, even if the mortgage is for less than five years.

Canada’s major chartered banks are currently advertising five-year fixed mortgage interest rates of around 3.2%. Homebuyers can often negotiate the interest rate for mortgage financing based on their creditworthiness and the degree to which they do other banking business with the mortgage lender.

The Bank of Canada’s next interest rate announcement will be on April 15, 2020 and will be accompanied by an update to the Bank of Canada’s Monetary Policy Report giving a more detailed outlook for the Canadian economy.

< Back to Newsroom

Changes to the mortgage stress test

Ottawa, ON, February 18, 2020 – Earlier today, Minister of Finance Bill Morneau announced changes to the mortgage stress test.

The new benchmark rate used to determine the minimum qualifying rate for insured mortgages, coming into effect on April 6, 2020, will be the weekly median 5-year fixed insured mortgage rate from mortgage insurance applications, plus 2 per cent.

Recently, the gap between the Bank of Canada’s five-year benchmark rate and borrowers’ actual contract rates has been widening, suggesting the benchmark rate has become less responsive to changes in the market.

In October 2016, Finance Canada introduced a stress test for insured mortgages. In 2017, the Office of the Superintendent of Financial Institutions (OSFI) issued an update to Guideline B-20, requiring uninsured mortgages to be stress-tested as of January 2018. CREA data indicates that per capita sales activity for residential units in 2018 reached its lowest point since 2001, with 2019’s final sales total tied for second-worst.

“REALTORS® have advocated for changes to the stress test on behalf of potential homeowners who have been sidelined, borrowers who have moved away from the regulated market to less-regulated options, and real estate markets across the country in need of relief,” said Jason Stephen, President of The Canadian Real Estate Association. “We are pleased the government has taken steps to address some of these issues in Canadian housing markets.”

In response to the impacts of the stress test, CREA has recommended:

  • reviewing the mortgage stress test to ensure the realities of local real estate markets are taken into consideration; and
  • allowing existing mortgage holders to be exempted from the stress test at the time of renewal.

CREA welcomes today’s announcement and acknowledges government’s efforts to help Canadians achieve their housing needs through policy reflective of market conditions.

CREA CEO Michael Bourque said “Today’s announcement introduces a more dynamic measure to act as a minimum qualifying rate. The Bank of Canada’s weekly median 5-year fixed insured mortgage rate plus 200 basis points will be more responsive.”

CREA will be providing input as OSFI considers the same benchmark rate for uninsured mortgages and will continue advocating for policy solutions that make it easier for Canadians to find a home that is right for them.

For more information, please contact:
Pierre Leduc, 
Media Relations
[email protected]
The Canadian Real Estate Association
200 Catherine Street, 6th Floor    Ottawa, ON K2P 2K9
Tel: +1 (613) 237-7111

< Back to Newsroom

Canadian home sales down in January

Ottawa, ON, February 14, 2020 – Statistics released today by the Canadian Real Estate Association (CREA) show national home sales declined between December 2019 and January 2020.

Highlights:

  • National home sales fell by 2.9% on a month-over-month (m-o-m) basis in January.
  • Actual (not seasonally adjusted) activity was up 11.5% year-over-year (y-o-y).
  • The number of newly listed properties was little changed (+0.2%) m-o-m.
  • The MLS® Home Price Index (HPI) advanced by 0.8% m-o-m and 4.7% y-o-y.
  • The actual (not seasonally adjusted) national average sale price climbed 11.2% y-o-y.

Home sales recorded over Canadian MLS® Systems declined by 2.9% in January 2020, although they remain among the stronger monthly readings of the last few years. (Chart A)

Transactions were down in a little over half of all local markets in January, with the national result most impacted by a slowdown of more than 18% in the Lower Mainland of British Columbia. While there were few notable gains in January, it should be noted that many of the weaker results have come alongside a shortage of new supply in markets where inventories are already very tight.

Actual (not seasonally adjusted) sales activity was still up 11.5% compared to January 2019, marking the best sales figures for the month in 12 years. Transactions surpassed year-ago levels in about two-thirds of all local markets, including most of the largest urban markets. As mentioned, some of the larger markets where sales were down, such as Ottawa and Windsor-Essex, are currently among some of the tightest supplied markets in Canada.

“Home price growth continues to pick up in housing markets where listings are in short supply, particularly in Southern, Central and Eastern Ontario,” said Jason Stephen, president of CREA. “Meanwhile, ample supply across the Prairies and in Newfoundland and Labrador is resulting in ongoing competition among sellers. All real estate is local, and nobody knows that better than a professional REALTOR®, your best source for information and guidance when negotiating the sale or purchase of a home,” said Stephen.

“Looking at local market trends across the country, one thing that stands out in markets with historically tight supply is a larger than normal drop in new listings at this time of the year,” said Shaun Cathcart, CREA’s Senior Economist. “The logic being that if you are a seller, you’re not just choosing when to list but effectively when to sell, so why not hold off until the spring when the weather is better, and more buyers are looking? Deferred listings mean deferred sales, which could explain some of January’s decline in activity. The question going forward is how many sellers are out there waiting to list their property, how much demand will respond, and how that will impact prices later this year.”

The number of newly listed homes was little changed in January, edging up a slight 0.2% on the heels of a series of declines which have left new listings at a near decade low. January’s small m-o-m change came as the result of declines in a number of larger markets, including Calgary, Edmonton and Montreal, which were offset by gains in the York and Durham Regions of the Greater Toronto Area (GTA) where new supply bounced back at the start of 2020 following a sharp slowdown towards the end of last year.

With sales down and new listings up slightly in January, the national sales-to-new listings ratio fell back to 65.1% compared to 67.2% posted in December 2019. Even so, the long-term average for this measure of housing market balance is 53.8%. It has been significantly above that long-term average for the last four months. Barring an unforeseen change in recent trends between the balance of supply and demand for homes, price gains appear poised to accelerate in 2020.

Considering the degree and duration to which market balance readings are above or below their long-term averages is the best way of gauging whether local housing market conditions favour buyers or sellers. Market balance measures that are within one standard deviation of their long-term average are generally consistent with balanced market conditions.

Based on a comparison of the sales-to-new listings ratio with the long-term average, close to two-thirds of all local markets were in balanced market territory in January 2020. Apart from a few areas of Alberta and Saskatchewan, the remainder were all favouring sellers.

The number of months of inventory is another important measure of the balance between sales and the supply of listings. It represents how long it would take to liquidate current inventories at the current rate of sales activity.

There were 4.2 months of inventory on a national basis at the end of January 2020 – the same as in November and December and the lowest level since the summer of 2007. This measure of market balance is now a full month below its long-term average of 5.2 months. While still just within balanced market territory, its current reading suggests that sales negotiations are becoming increasingly tilted in favour of sellers.

National measures of market balance continue to mask significant and increasing regional variations. The number of months of inventory has swollen far beyond long-term averages in the Prairie provinces

and Newfoundland & Labrador, giving homebuyers ample choice in these regions. By contrast, the measure is running well below long-term averages in Ontario, Quebec and the Maritime provinces, resulting in increased competition among buyers for listings and providing fertile ground for price gains. The measure is still in balanced market territory in British Columbia.

The Aggregate Composite MLS® Home Price Index (MLS® HPI) rose 0.8% in January 2020 compared to December, marking its eighth consecutive monthly gain. It is now up 5.5% from last year’s lowest point in May and has set new records in each of the past six months. (Chart B)

The MLS® HPI in January was up from the previous month in 14 of the 18 markets tracked by the index. (Table 1)

Home price trends have generally been stabilizing in most Prairie markets in recent months following lengthy declines. Meanwhile, prices are clearly on the rise again in British Columbia and in Ontario’s Greater Golden Horseshoe (GGH). Further east, price growth in Ottawa, Montreal and Moncton continues as it has for some time now, with Montreal and particularly Ottawa having strengthened noticeably in recent months.

Comparing home prices to year-ago levels yields considerable variations across the country, although for the most part trends are still regionally split along east/west lines, with rising gains from Ontario east, and a mixed bag of smaller gains and declines in B.C. and the Prairies.

The actual (not seasonally adjusted) Aggregate Composite MLS® (HPI) rose 4.7% y-o-y in January, the biggest year-over-year gain since February 2018.

Home prices in Greater Vancouver (-1.2%) remain slightly below year-ago levels, but declines are still shrinking. Meanwhile, January saw prices back in positive y-o-y territory in the Fraser Valley (+0.3%). Elsewhere in British Columbia, home prices logged y-o-y increases in the Okanagan Valley (+3.5%), Victoria (+3.4%) and elsewhere on Vancouver Island (+4%).

Calgary, Edmonton and Saskatoon continued to post small y-o-y price declines, while the y-o-y gap has now widened to -6.9% in Regina.

In Ontario, home price growth has re-accelerated across most of the GGH, with a number of markets getting close to double digits. Meanwhile, price gains in recent years have continued uninterrupted in Ottawa (+13.7%), Montreal (+9.8%) and Moncton (+6.4%).

All benchmark home categories tracked by the index accelerated further into positive territory on a y-o-y basis, with similar sized gains among the different property types.

Apartment unit prices posted the biggest y-o-y increase (+5%) followed closely by two-storey single family homes (+4.8%), one-storey single-family homes (+4.4%) and townhouse/row units (+4.2%).

The MLS® HPI provides the best way to gauge price trends, because averages are strongly distorted by changes in the mix of sales activity from one month to the next.

The actual (not seasonally adjusted) national average price for homes sold in January 2020 was around $504,350, up 11.2% from the same month the previous year. This was the largest increase since mid-2016.

The national average price is heavily influenced by sales in the GVA and GTA, two of Canada’s most active and expensive housing markets. Excluding these two markets from calculations cuts close to $110,000 from the national average price, trimming it to around $395,000.

– 30 –

PLEASE NOTE: The information contained in this news release combines both major market and national sales information from MLS® Systems from the previous month.

CREA cautions that average price information can be useful in establishing trends over time, but does not indicate actual prices in centres comprised of widely divergent neighbourhoods or account for price differential between geographic areas. Statistical information contained in this report includes all housing types.

MLS® Systems are co-operative marketing systems used only by Canada’s real estate Boards to ensure maximum exposure of properties listed for sale.

The Canadian Real Estate Association (CREA) is one of Canada’s largest single-industry associations, representing more than 130,000 REALTORS® working through 90 real estate boards and associations.

Further information can be found at http://crea.ca/statistics.

For more information, please contact:
Pierre Leduc, Media Relations
The Canadian Real Estate Association
Tel.: 613-237-7111 or 613-884-1460
E-mail: [email protected]

< Back to Newsroom

CREA’s Chief Economist, Gregory Klump, retires after 28 years

Ottawa, ON, February 11, 2020 –  Gregory Klump, CREA’s Chief Economist, has retired from The Canadian Real Estate Association after 28 years.

Greg Klump

Klump joined CREA in 1992, serving as staff economist for the Association. Promoted to Chief Economist in 2005, he grew CREA’s economic and data team into an authoritative source of Canadian real estate data and market analysis.

Klump was instrumental in the development of the MLS® Home Price Index (MLS HPI®). He was a member of CMHC’s National Housing Research Committee as well as a contributor to the Economic Research Committee of the Canadian Home Builders Association.

CREA wishes Gregory Klump all the best in his future endeavors.

– 30 –

About The Canadian Real Estate Association
The Canadian Real Estate Association (CREA) is one of Canada’s largest single-industry associations. CREA works on behalf of more than 130,000 REALTORS® who contribute to the economic and social well-being of communities across Canada. Together they advocate for property owners, buyers and sellers.

For more information, please contact:
Pierre Leduc, Media Relations
The Canadian Real Estate Association
Tel.: 613-237-7111 or 613-884-1460
E-mail: [email protected]­

< Back to Newsroom