Canadian home sales activity strengthens in July
Ottawa, ON, August 15, 2018 – Statistics released today by The Canadian Real Estate Association (CREA) show national home sales were up from June to July 2018.
Highlights:
- National home sales rose 1.9% from June to July.
- Actual (not seasonally adjusted) activity was down 1.3% from July 2017.
- The number of newly listed homes edged down 1.2% from June to July.
- The MLS® Home Price Index (HPI) in July was up 2.1% year-over-year (y-o-y).
- The national average sale price edged up 1% y-o-y.
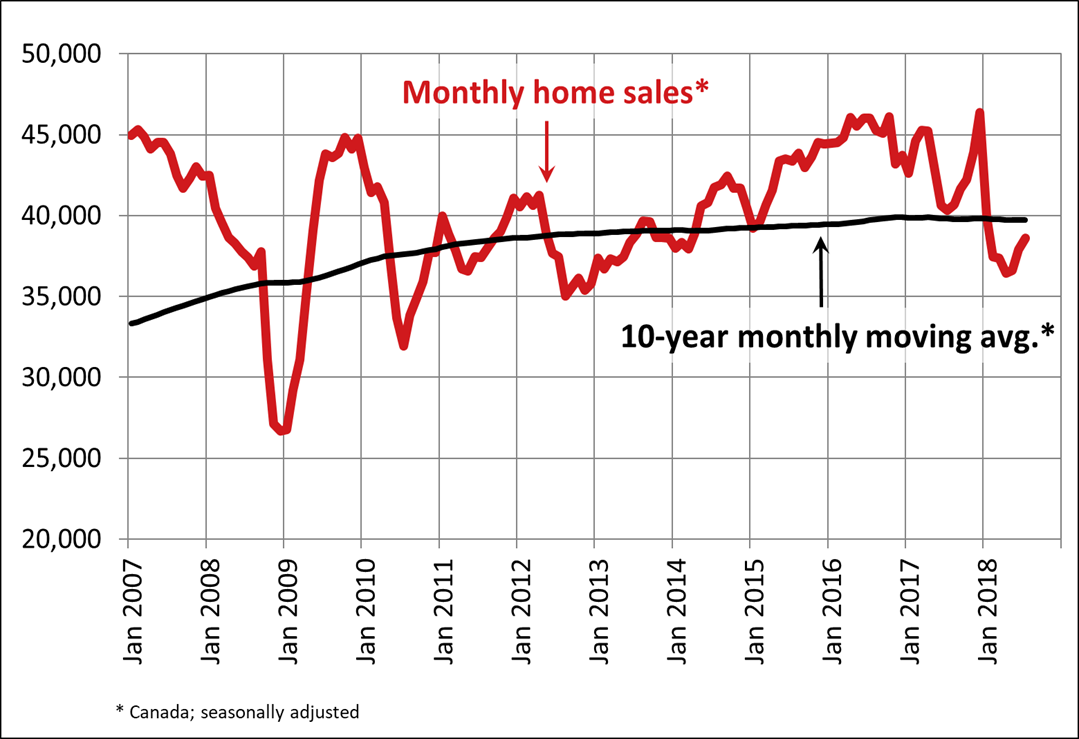
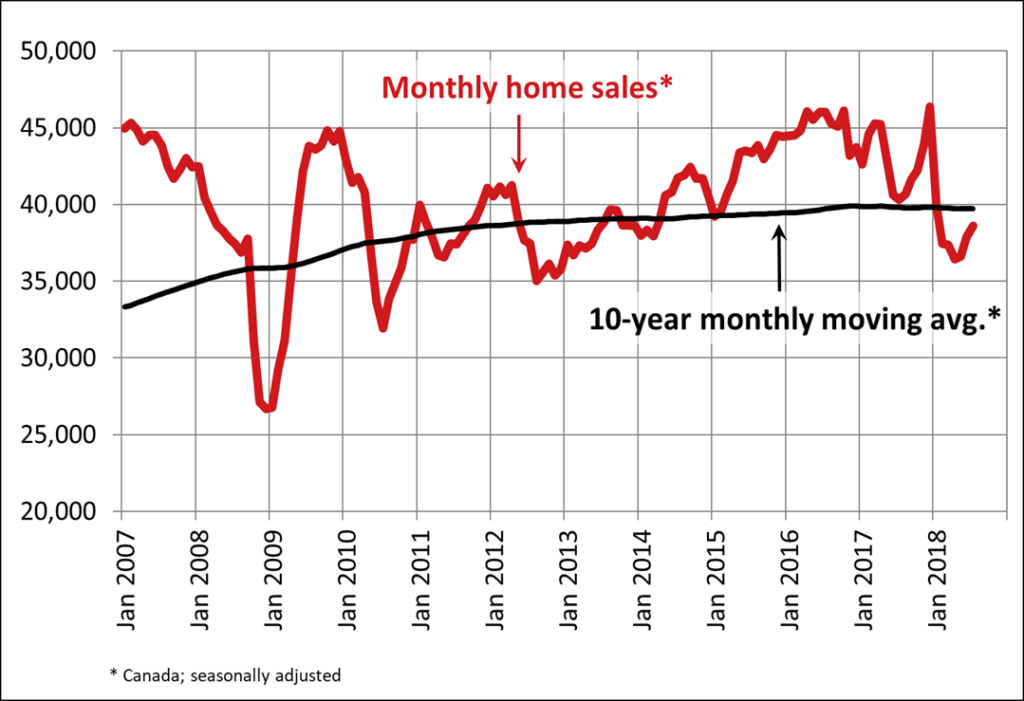
National home sales via Canadian MLS® Systems rose 1.9% in July 2018, building on increases in each of the two previous months but still running below levels recorded from mid-2013 to the end of last year (Chart A). Led by the Greater Toronto Area (GTA), more than half of all local housing markets reported an increase sales activity from June to July.
Actual (not seasonally adjusted) activity was down 1.3% y-o-y. The result reflects fewer sales in major urban centres in British Columbia and an offsetting improvement in activity in the GTA.
“This year’s new stress-test on mortgage applicants continues to weigh on home sales but its effect may be starting to fade slightly in Toronto and nearby markets,” said CREA President Barb Sukkau. “The degree to which the stress-test continues to sideline home buyers varies depending on location, housing type and price range. All real estate is local, and REALTORS® remain your best source for information about sales and listings where you live or might like to in the future,” said Sukkau.
“Improving national home sales activity in recent months obscures significant differences in regional trends for home sales and prices,” said Gregory Klump, CREA’s Chief Economist. “Regardless, rising interest rates and this year’s stress test on mortgage applicants will likely prove to be difficult hurdles to overcome for many would-be first time and move-up homebuyers, heading into the second half of the year and beyond.”
The number of newly listed homes retreated 1.2% in July and stood below monthly levels recorded over most of the past eight years. New listings were down in more than half of all local markets, led by Calgary, Edmonton and Greater Vancouver (GVA). Fewer new listings in these markets more than offset an increase in new supply in the GTA.
With sales up and new listings down, the national sales-to-new listings ratio tightened further to reach 55.9% in July. This reading nonetheless remains within short reach of the long-term average of 53.4% for this measure of market balance.
Considering the degree and duration to which market balance readings are above or below their long-term average is a useful way of gauging whether local housing market conditions favour buyers or sellers. As a rule of thumb, measures of market balance that are within one standard deviation of their long-term average are generally consistent with balanced market conditions.
Based on a comparison of the sales-to-new listings ratio with the long-term average, about two-thirds of all local markets were in balanced market territory in July 2018.
The number of months of inventory is another important measure for the balance between housing supply and demand. It represents how long it would take to liquidate current inventories at the current rate of sales activity.
There were 5.3 months of inventory on a national basis at the end of July 2018, down from 5.4 months in June and near the long-term average of 5.2 months.
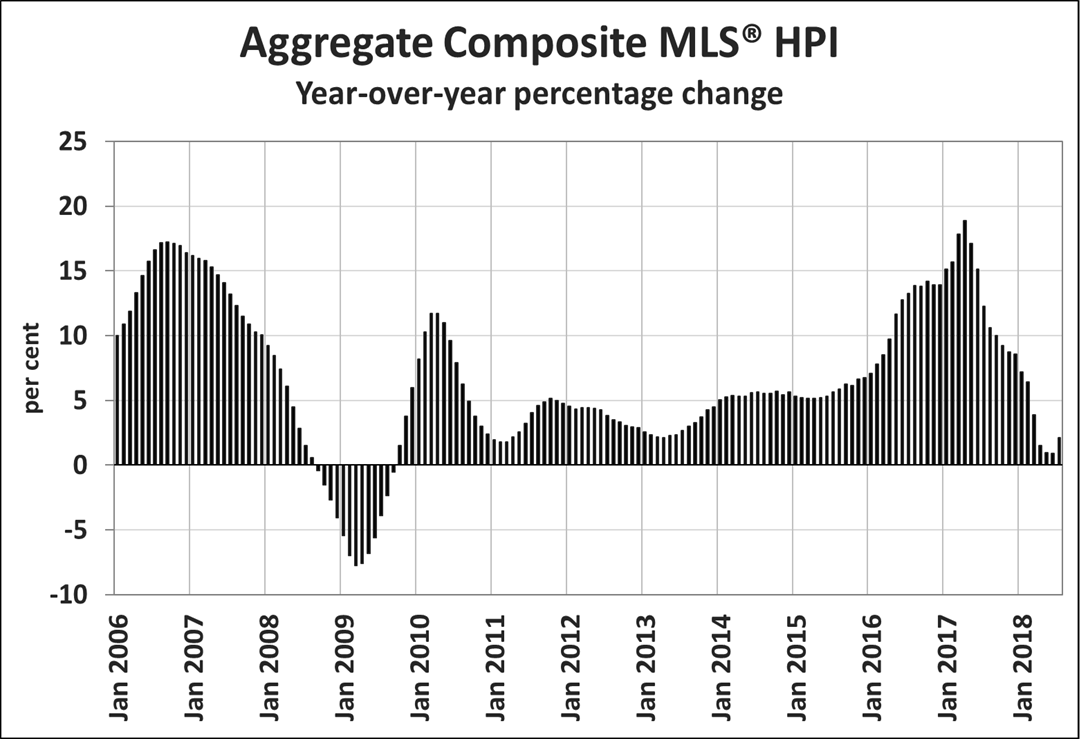
The Aggregate Composite MLS® Home Price Index (MLS® HPI) was up 2.1% y-o-y in July 2018. This represents the first acceleration in y-o-y home price growth since April 2017. It also suggests that the dip in home prices last summer and their subsequent rebound in and around the GTA may contribute to further y-o-y gains in the months ahead.
Apartment units posted the largest y-o-y price gains in July (+10.1%), followed by townhouse/row units (+4.7%). By contrast, one-storey and two-storey single family home prices were again down from year-ago levels in July (-0.7% and -1.5% respectively) but the declines were noticeably smaller than in recent months.
Trends continue to vary widely among the 15 housing markets tracked by the MLS® HPI, with home prices up from year-ago levels in eight of them, little changed in two of them and down in the remainder.
Home price gains are diminishing on a y-o-y basis in the Lower Mainland of British Columbia (GVA: +6.7%; Fraser Valley: +13.8%), Victoria (+8.2%) and elsewhere on Vancouver Island (+13.7%).
Among Golden Horseshoe housing markets tracked by the index, home prices remained above year-ago levels in Guelph (+4.1%) and stabilized in Oakville-Milton (+0.1%). By contrast, home prices remained down on a y-o-y basis in the GTA (-0.6%) and Barrie and District (-3%).
In the Prairies, benchmark home prices remained down on a y-o-y basis in Calgary (-1.7%), Edmonton (-1.3%), Regina (-4.8%) and Saskatoon (-2.1%).
Meanwhile, benchmark home prices rose by 7.2% y-o-y in Ottawa (led by an 8.3% increase in two-storey single family home prices), by 5.7% in Greater Montreal (led by a 7% increase in townhouse/row unit prices) and by 5% in Greater Moncton (led by a 9.9% increase in apartment unit prices). (Table 1)
MLS® HPI provides the best way of gauging price trends because average price trends are strongly distorted by changes in the mix of sales activity from one month to the next.
The actual (not seasonally adjusted) national average price for homes sold in July 2018 was just under $481,500, up 1% from the same month last year. This was the first year-over-year increase since January.
The national average price is heavily skewed by sales in the GVA and GTA, two of Canada’s most active and expensive markets. Excluding these two markets from calculations cuts close to $100,000 from the national average price, trimming it to just under $383,000.
– 30 –
PLEASE NOTE: The information contained in this news release combines both major market and national sales information from MLS® Systems from the previous month.
CREA cautions that average price information can be useful in establishing trends over time, but does not indicate actual prices in centres comprised of widely divergent neighbourhoods or account for price differential between geographic areas. Statistical information contained in this report includes all housing types.
MLS® Systems are co-operative marketing systems used only by Canada’s real estate Boards to ensure maximum exposure of properties listed for sale.
The Canadian Real Estate Association (CREA) is one of Canada’s largest single-industry trade associations. CREA works on behalf of more than 125,000 REALTORS® who contribute to the economic and social well-being of communities across Canada. Together they advocate for property owners, buyers and sellers.
Further information can be found at http://crea.ca/statistics.
For more information, please contact:
Pierre Leduc, Media Relations
The Canadian Real Estate Association
Tel.: 613-237-7111 or 613-884-1460
E-mail: [email protected]


Leave a Reply
Want to join the discussion?Feel free to contribute!