Canadian home sales activity softens further in November
Ottawa, ON, December 17, 2018 – Statistics released today by the Canadian Real Estate Association (CREA) show national home sales posted another monthly decline in November 2018.
Highlights:
- National home sales fell 2.3% from October to November.
- Actual (not seasonally adjusted) activity was down by 12.6% from one year ago.
- The number of newly listed homes declined by 3.3% from October to November.
- The MLS® Home Price Index (HPI) was up 2% year-over-year (y-o-y) in November.
- The national average sale price retreated by 2.9% y-o-y in November.
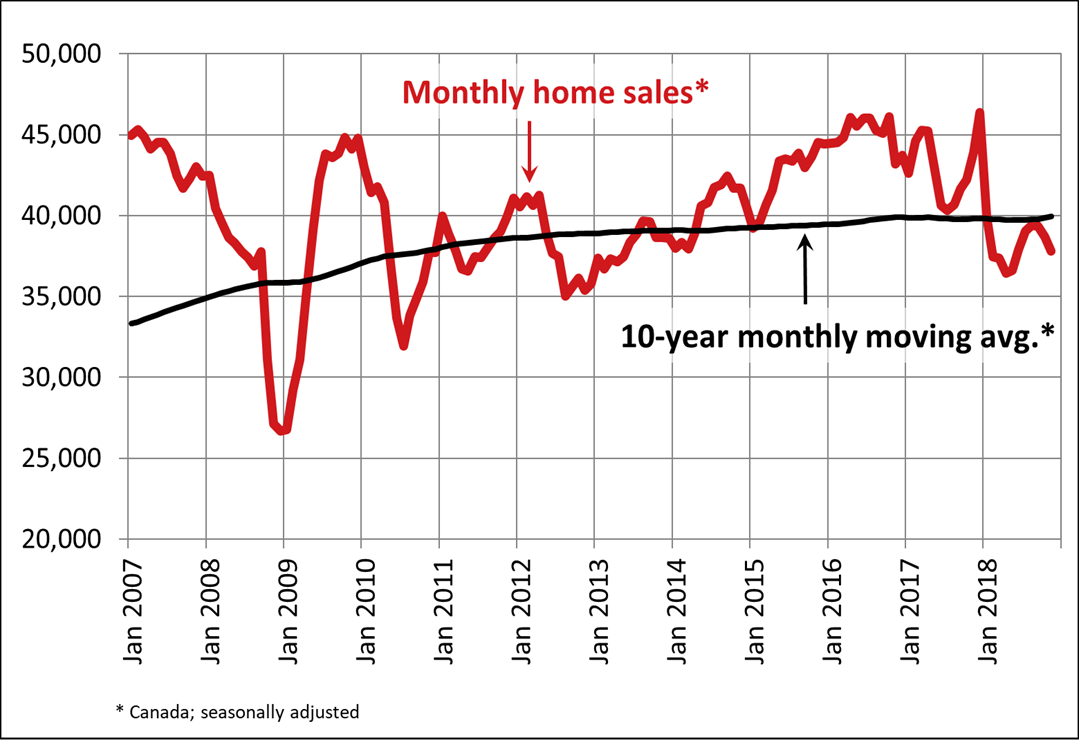
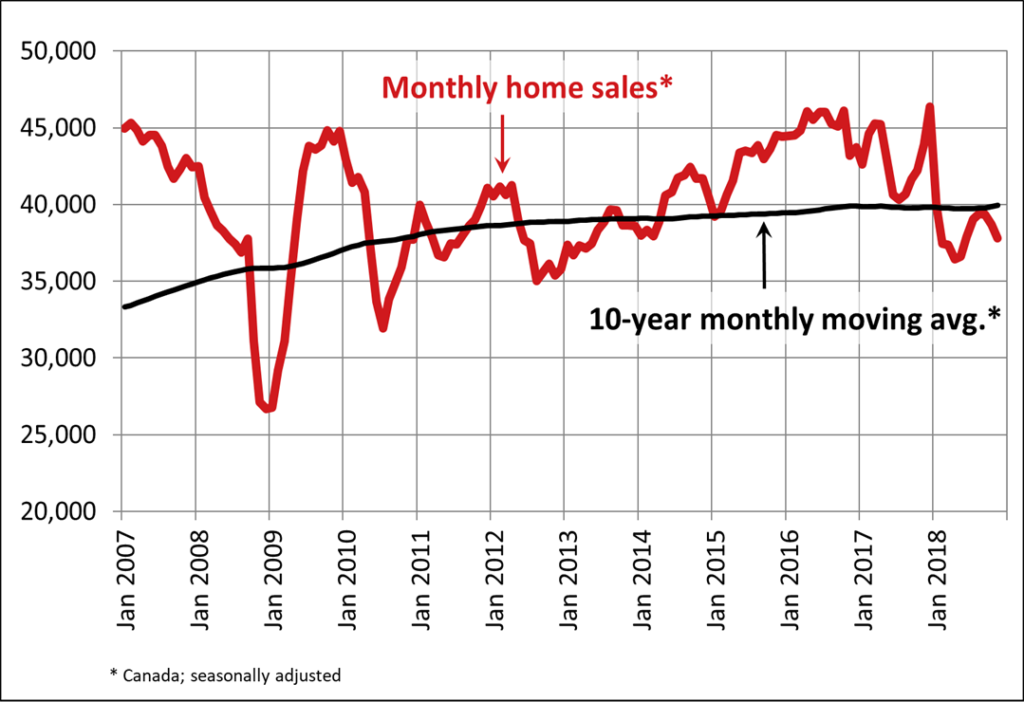
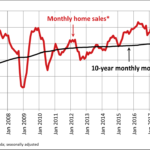
Home sales via Canadian MLS® Systems fell by 2.3% in November 2018, adding to the decline in October of 1.7%. While the number of homes trading hands is still up from its low point in the spring, it remains below monthly levels posted from 2014 through 2017. (Chart A)
Transactions declined in just over half of all local markets, with lower activity in the Greater Toronto Area (GTA), the Greater Vancouver Area (GVA) and Hamilton-Burlington offsetting increased sales in Edmonton.
Actual (not seasonally adjusted) activity was down 12.6% y-o-y and came in below the 10-year average for the month of November. Sales were down from year-ago levels in three-quarters of all local markets, including the Lower Mainland of British Columbia, Calgary, the GTA and Hamilton-Burlington.
“National sales activity has lost a bit of momentum over the past couple of months, but local market trends can be, and very often are, different by comparison,” said CREA President Barb Sukkau. “All real estate is local. A professional REALTOR® remains your best source for information and guidance in negotiating the purchase or sale of a home during these changing times,” added Sukkau.
“The decline in homeownership affordability caused by this year’s new mortgage stress-test remains very much in evidence,” said Gregory Klump, CREA’s Chief Economist. “Despite supportive economic and demographic fundamentals, national home sales have begun trending lower. While national home sales were anticipated to recover in the wake of a large drop in activity earlier this year due to the introduction of the stress-test, the rebound appears to have run its course.”
The number of newly listed homes fell by 3.3% between October and November, with new supply declining in roughly 70% of all local markets.
With new listings having declined by more than sales in November, the national sales-to-new listings ratio tightened slightly to 54.8% compared to 54.2% in October. This measure of market balance has remained close to its long-term average of 53.4% since the beginning of 2018.
Considering the degree and duration to which market balance readings are above or below their long-term averages is the best way of gauging whether local housing market conditions favour buyers or sellers. Market balance measures that are within one standard deviation of their long-term average are generally consistent with balanced market conditions.
Based on a comparison of the sales-to-new listings ratio with the long-term average, about 60% of all local markets were in balanced market territory in November 2018.
The number of months of inventory is another important measure for the balance between sales and the supply of listings. It represents how long it would take to liquidate current inventories at the current rate of sales activity.
There were 5.4 months of inventory on a national basis at the end of November 2018. While this remains in line with its long-term average of 5.3 months, the number of months of inventory is well above its long-term average in the Prairie provinces as well as in Newfoundland & Labrador. By contrast, the measure is well below its long-term average in Ontario, New Brunswick and Prince Edward Island. In other provinces, sales and inventory are more balanced.
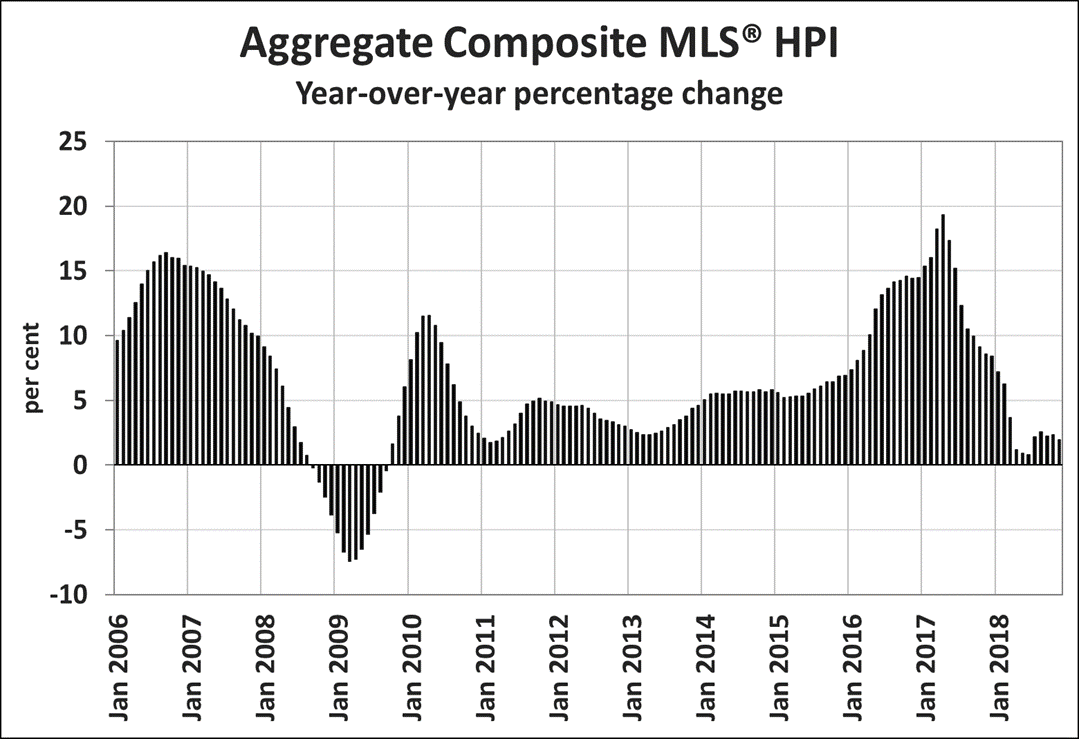
The Aggregate Composite MLS® Home Price Index (MLS® HPI) was up 2% y-o-y in November 2018. The increase is similar to gains posted since July. (Chart B)
Apartment units posted the largest y-o-y price gains in November (+6%), followed by townhouse/row units (+4%). By comparison, one-storey single-family homes posted a modest increase (+0.4%) while two-storey single-family home prices held steady (+0.1%).
Trends continue to vary widely among the 17 housing markets tracked by the MLS® HPI. In British Columbia, home price gains have been steadily diminishing on a y-o-y basis in the Fraser Valley (+4.7%) and Victoria (+7.2%). By contrast, price gains picked up elsewhere on Vancouver Island (+12.6%) and, for the first time in five years, were down (-1.4%) from year-ago levels in the GVA.
Among housing markets tracked by the index in the Greater Golden Horseshoe region, MLS® HPI benchmark home prices were up from year-ago levels in Guelph (+9.3%), the Niagara Region (+7.2%), Hamilton-Burlington (+6.3%), Oakville-Milton (+3.4%) and the GTA (+2.7%). Meanwhile, home prices in Barrie and District remain below year-ago levels (-2.1%).
Across the Prairies, benchmark home prices remained below year-ago levels in Calgary (-2.9%), Edmonton (-1.9%), Regina (-4%) and Saskatoon (-0.3%). Amid elevated supply relative to sales, the home pricing environment will remain weak in these housing markets until they become better balanced.
Home prices rose 6.6% y-o-y in Ottawa (led by a 7.3% increase in two-storey single-family home prices), 6.2% in Greater Montreal (led by a 9.4% increase in townhouse/row unit prices) and 4.2% in Greater Moncton (led by an 11.2% increase in townhouse/row unit prices). (Table 1)
The MLS® HPI provides the best way to gauge price trends because average price trends are strongly distorted by changes in the mix of sales activity from one month to the next.
The actual (not seasonally adjusted) national average price for homes sold in November 2018 was just over $488,000, down 2.9% from the same month last year.
The national average price is heavily skewed by sales in Greater Vancouver and the GTA, two of Canada’s most active and expensive markets. Excluding these two markets from calculations cuts almost $110,000 from the national average price, trimming it to just over $378,000.
– 30 –
PLEASE NOTE: The information contained in this news release combines both major market and national sales information from MLS® Systems from the previous month.
CREA cautions that average price information can be useful in establishing trends over time, but does not indicate actual prices in centres comprised of widely divergent neighbourhoods or account for price differential between geographic areas. Statistical information contained in this report includes all housing types.
MLS® Systems are co-operative marketing systems used only by Canada’s real estate Boards to ensure maximum exposure of properties listed for sale.
The Canadian Real Estate Association (CREA) is one of Canada’s largest single-industry trade associations, representing more than 125,000 REALTORS® working through some 90 real estate Boards and Associations.
Further information can be found at http://crea.ca/statistics.
For more information, please contact:
Pierre Leduc, Media Relations
The Canadian Real Estate Association
Tel.: 613-237-7111 or 613-884-1460
E-mail: [email protected]


Leave a Reply
Want to join the discussion?Feel free to contribute!