Changes to the mortgage stress test

Ottawa, ON, February 18, 2020 – Earlier today, Minister of Finance Bill Morneau announced changes to the mortgage stress test.

The new benchmark rate used to determine the minimum qualifying rate for insured mortgages, coming into effect on April 6, 2020, will be the weekly median 5-year fixed insured mortgage rate from mortgage insurance applications, plus 2 per cent.

Recently, the gap between the Bank of Canada’s five-year benchmark rate and borrowers’ actual contract rates has been widening, suggesting the benchmark rate has become less responsive to changes in the market.

In October 2016, Finance Canada introduced a stress test for insured mortgages. In 2017, the Office of the Superintendent of Financial Institutions (OSFI) issued an update to Guideline B-20, requiring uninsured mortgages to be stress-tested as of January 2018. CREA data indicates that per capita sales activity for residential units in 2018 reached its lowest point since 2001, with 2019’s final sales total tied for second-worst.

“REALTORS® have advocated for changes to the stress test on behalf of potential homeowners who have been sidelined, borrowers who have moved away from the regulated market to less-regulated options, and real estate markets across the country in need of relief,” said Jason Stephen, President of The Canadian Real Estate Association. “We are pleased the government has taken steps to address some of these issues in Canadian housing markets.”

In response to the impacts of the stress test, CREA has recommended:

  • reviewing the mortgage stress test to ensure the realities of local real estate markets are taken into consideration; and
  • allowing existing mortgage holders to be exempted from the stress test at the time of renewal.

CREA welcomes today’s announcement and acknowledges government’s efforts to help Canadians achieve their housing needs through policy reflective of market conditions.

CREA CEO Michael Bourque said “Today’s announcement introduces a more dynamic measure to act as a minimum qualifying rate. The Bank of Canada’s weekly median 5-year fixed insured mortgage rate plus 200 basis points will be more responsive.”

CREA will be providing input as OSFI considers the same benchmark rate for uninsured mortgages and will continue advocating for policy solutions that make it easier for Canadians to find a home that is right for them.

For more information, please contact:
Pierre Leduc, 
Media Relations
[email protected]
The Canadian Real Estate Association
200 Catherine Street, 6th Floor    Ottawa, ON K2P 2K9
Tel: +1 (613) 237-7111

< Back to Newsroom

Canadian home sales down in January

Ottawa, ON, February 14, 2020 – Statistics released today by the Canadian Real Estate Association (CREA) show national home sales declined between December 2019 and January 2020.

Highlights:

  • National home sales fell by 2.9% on a month-over-month (m-o-m) basis in January.
  • Actual (not seasonally adjusted) activity was up 11.5% year-over-year (y-o-y).
  • The number of newly listed properties was little changed (+0.2%) m-o-m.
  • The MLS® Home Price Index (HPI) advanced by 0.8% m-o-m and 4.7% y-o-y.
  • The actual (not seasonally adjusted) national average sale price climbed 11.2% y-o-y.

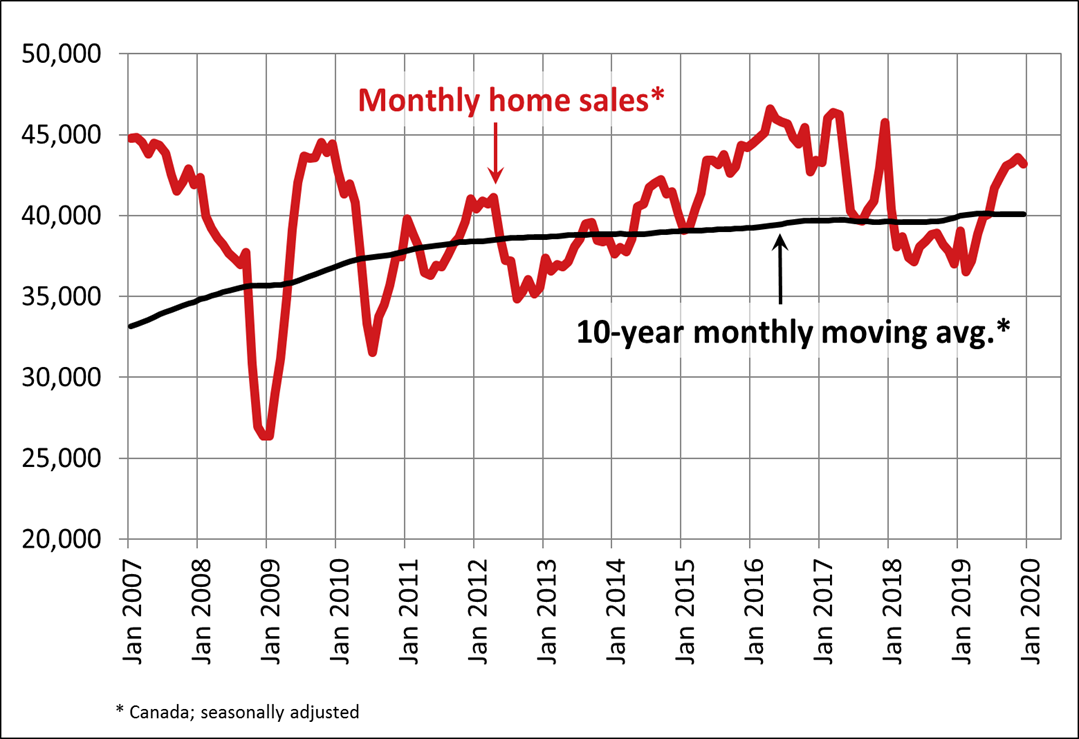
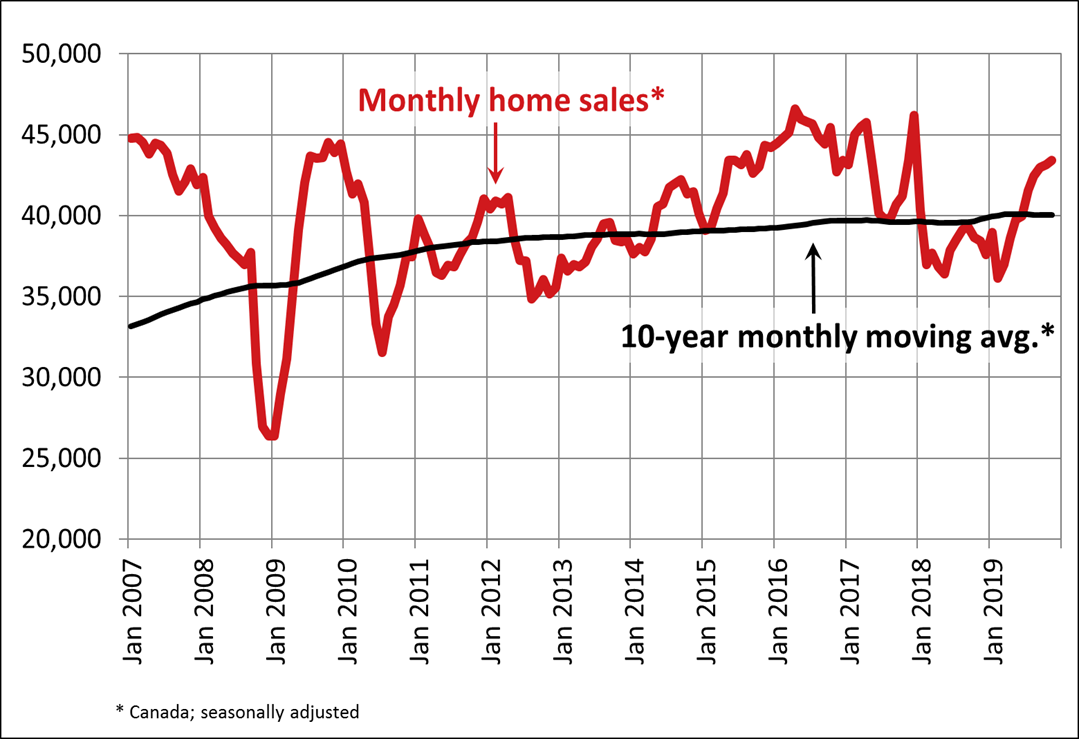
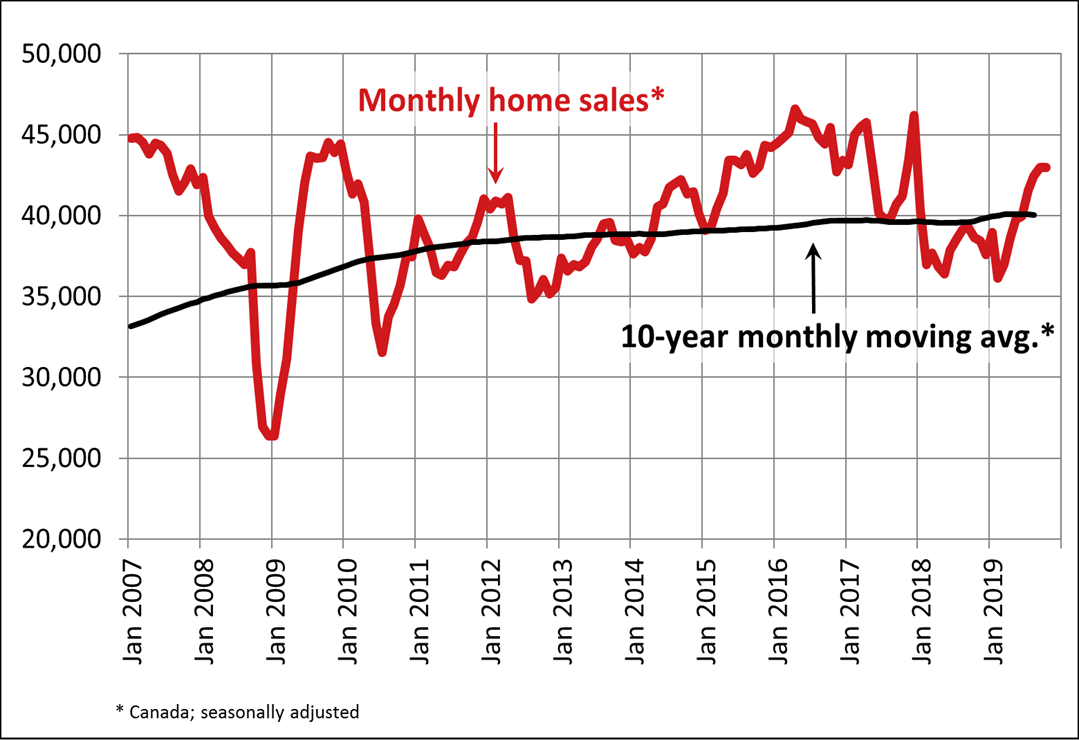
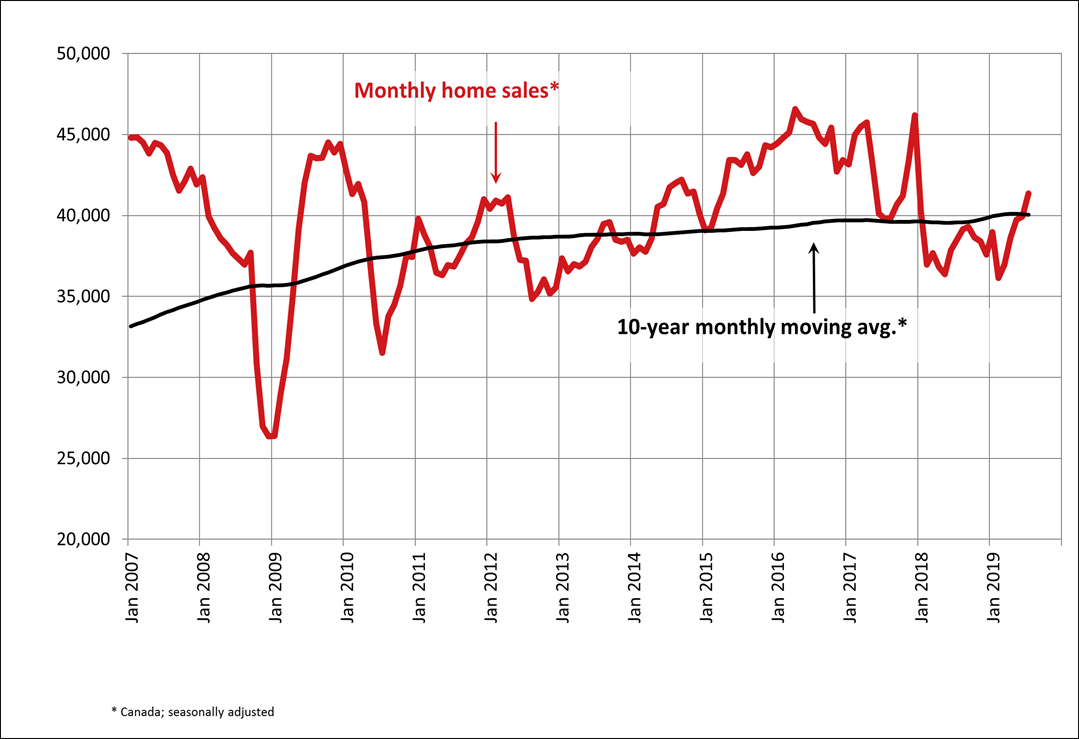
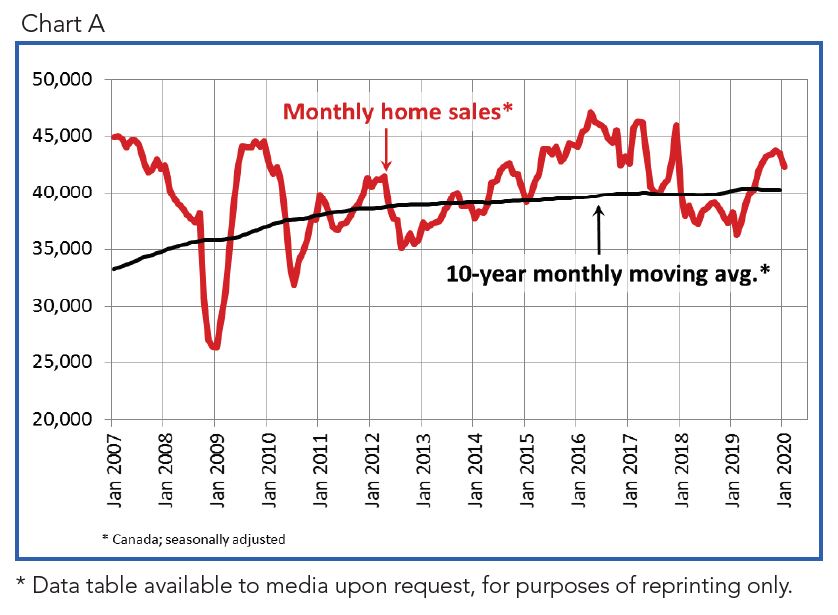
Home sales recorded over Canadian MLS® Systems declined by 2.9% in January 2020, although they remain among the stronger monthly readings of the last few years. (Chart A)

Transactions were down in a little over half of all local markets in January, with the national result most impacted by a slowdown of more than 18% in the Lower Mainland of British Columbia. While there were few notable gains in January, it should be noted that many of the weaker results have come alongside a shortage of new supply in markets where inventories are already very tight.

Actual (not seasonally adjusted) sales activity was still up 11.5% compared to January 2019, marking the best sales figures for the month in 12 years. Transactions surpassed year-ago levels in about two-thirds of all local markets, including most of the largest urban markets. As mentioned, some of the larger markets where sales were down, such as Ottawa and Windsor-Essex, are currently among some of the tightest supplied markets in Canada.

“Home price growth continues to pick up in housing markets where listings are in short supply, particularly in Southern, Central and Eastern Ontario,” said Jason Stephen, president of CREA. “Meanwhile, ample supply across the Prairies and in Newfoundland and Labrador is resulting in ongoing competition among sellers. All real estate is local, and nobody knows that better than a professional REALTOR®, your best source for information and guidance when negotiating the sale or purchase of a home,” said Stephen.

“Looking at local market trends across the country, one thing that stands out in markets with historically tight supply is a larger than normal drop in new listings at this time of the year,” said Shaun Cathcart, CREA’s Senior Economist. “The logic being that if you are a seller, you’re not just choosing when to list but effectively when to sell, so why not hold off until the spring when the weather is better, and more buyers are looking? Deferred listings mean deferred sales, which could explain some of January’s decline in activity. The question going forward is how many sellers are out there waiting to list their property, how much demand will respond, and how that will impact prices later this year.”

The number of newly listed homes was little changed in January, edging up a slight 0.2% on the heels of a series of declines which have left new listings at a near decade low. January’s small m-o-m change came as the result of declines in a number of larger markets, including Calgary, Edmonton and Montreal, which were offset by gains in the York and Durham Regions of the Greater Toronto Area (GTA) where new supply bounced back at the start of 2020 following a sharp slowdown towards the end of last year.

With sales down and new listings up slightly in January, the national sales-to-new listings ratio fell back to 65.1% compared to 67.2% posted in December 2019. Even so, the long-term average for this measure of housing market balance is 53.8%. It has been significantly above that long-term average for the last four months. Barring an unforeseen change in recent trends between the balance of supply and demand for homes, price gains appear poised to accelerate in 2020.

Considering the degree and duration to which market balance readings are above or below their long-term averages is the best way of gauging whether local housing market conditions favour buyers or sellers. Market balance measures that are within one standard deviation of their long-term average are generally consistent with balanced market conditions.

Based on a comparison of the sales-to-new listings ratio with the long-term average, close to two-thirds of all local markets were in balanced market territory in January 2020. Apart from a few areas of Alberta and Saskatchewan, the remainder were all favouring sellers.

The number of months of inventory is another important measure of the balance between sales and the supply of listings. It represents how long it would take to liquidate current inventories at the current rate of sales activity.

There were 4.2 months of inventory on a national basis at the end of January 2020 – the same as in November and December and the lowest level since the summer of 2007. This measure of market balance is now a full month below its long-term average of 5.2 months. While still just within balanced market territory, its current reading suggests that sales negotiations are becoming increasingly tilted in favour of sellers.

National measures of market balance continue to mask significant and increasing regional variations. The number of months of inventory has swollen far beyond long-term averages in the Prairie provinces

and Newfoundland & Labrador, giving homebuyers ample choice in these regions. By contrast, the measure is running well below long-term averages in Ontario, Quebec and the Maritime provinces, resulting in increased competition among buyers for listings and providing fertile ground for price gains. The measure is still in balanced market territory in British Columbia.

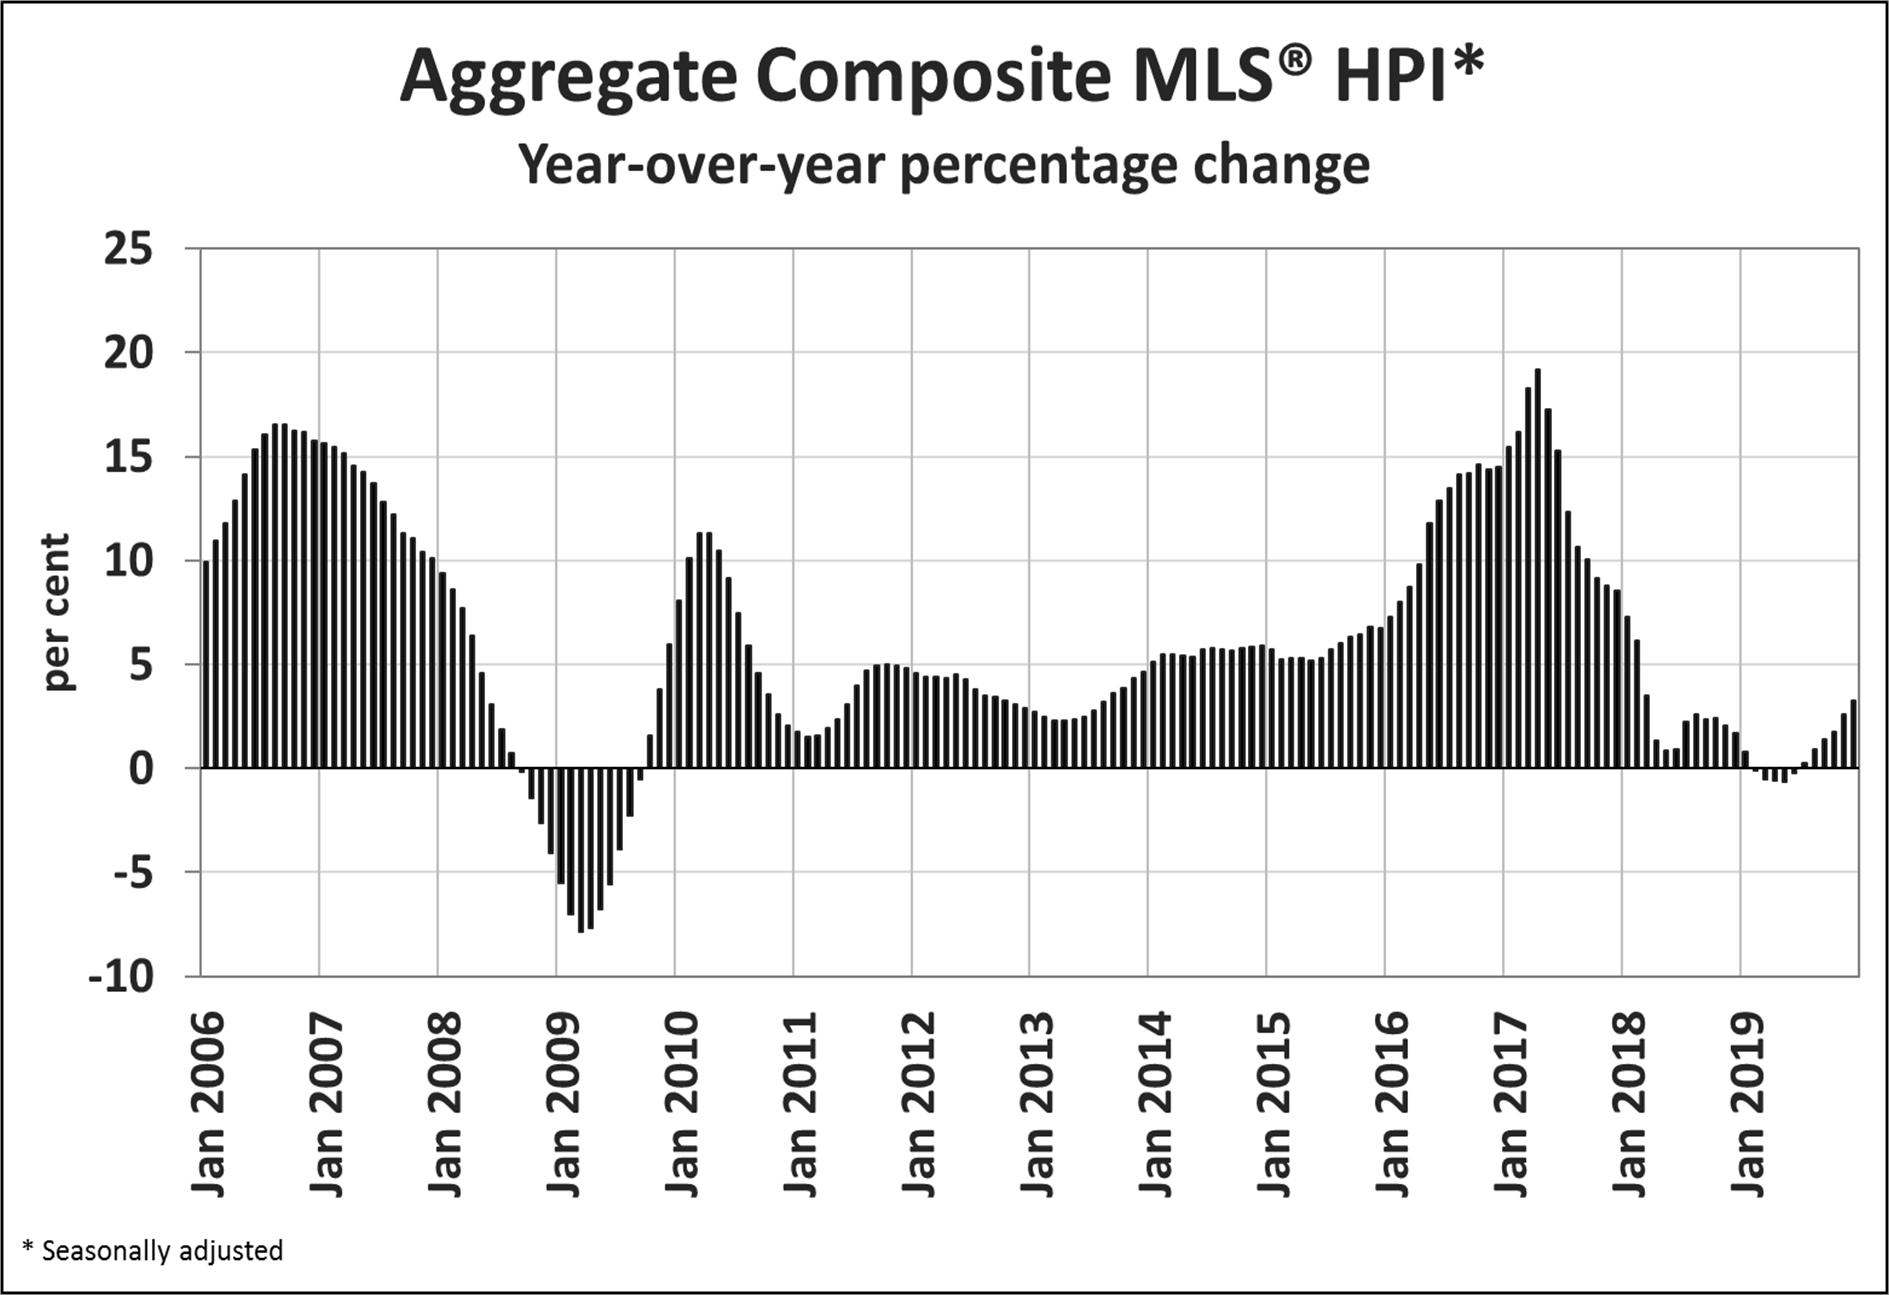
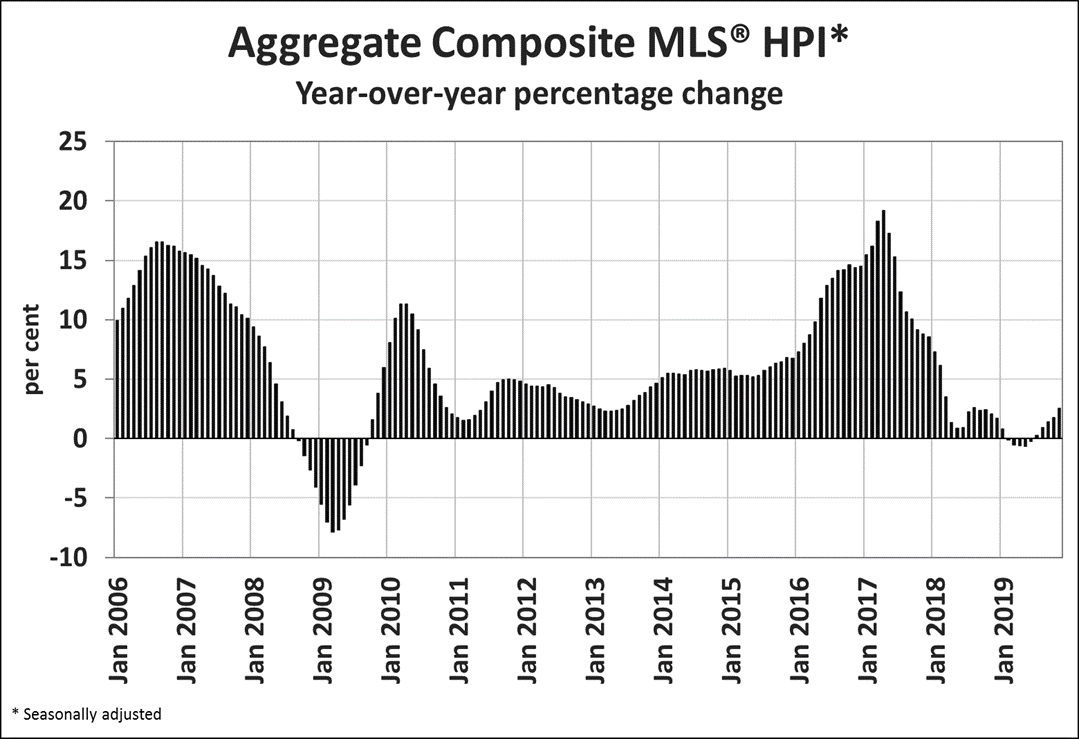
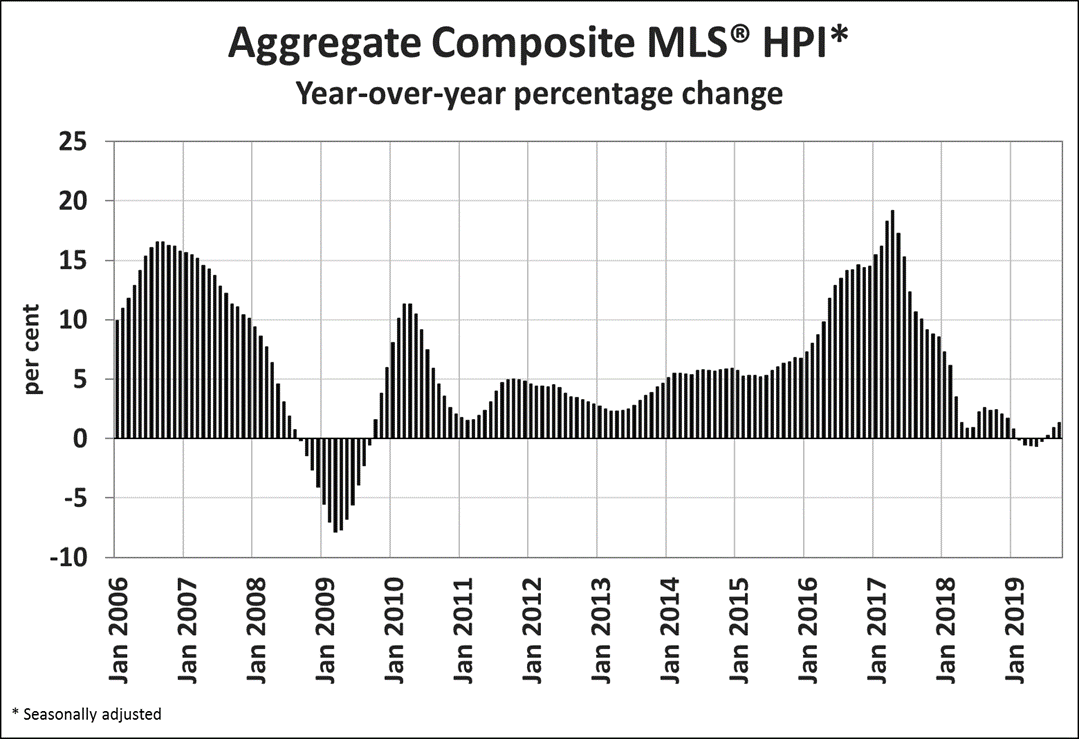
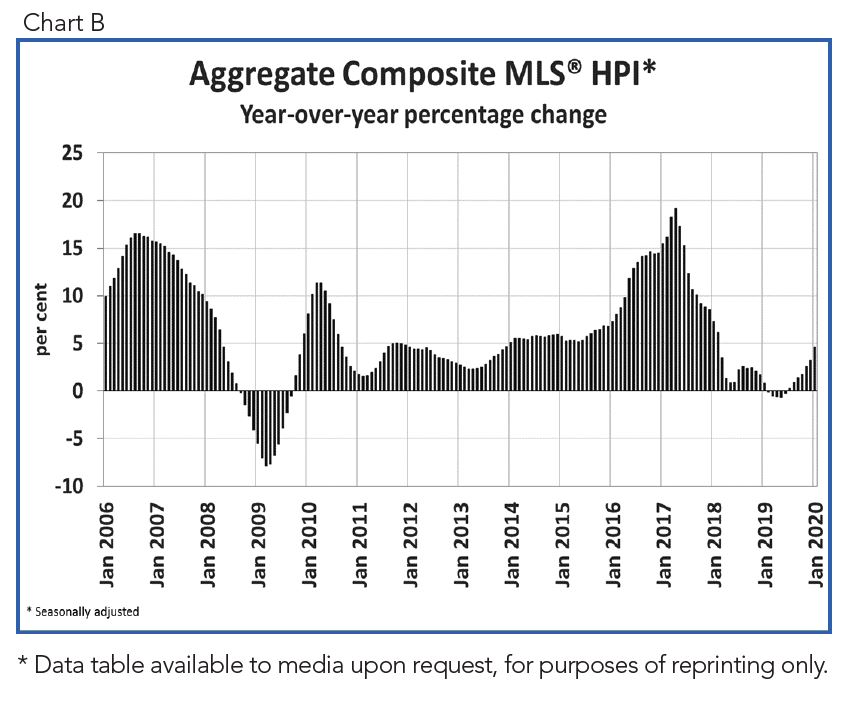
The Aggregate Composite MLS® Home Price Index (MLS® HPI) rose 0.8% in January 2020 compared to December, marking its eighth consecutive monthly gain. It is now up 5.5% from last year’s lowest point in May and has set new records in each of the past six months. (Chart B)

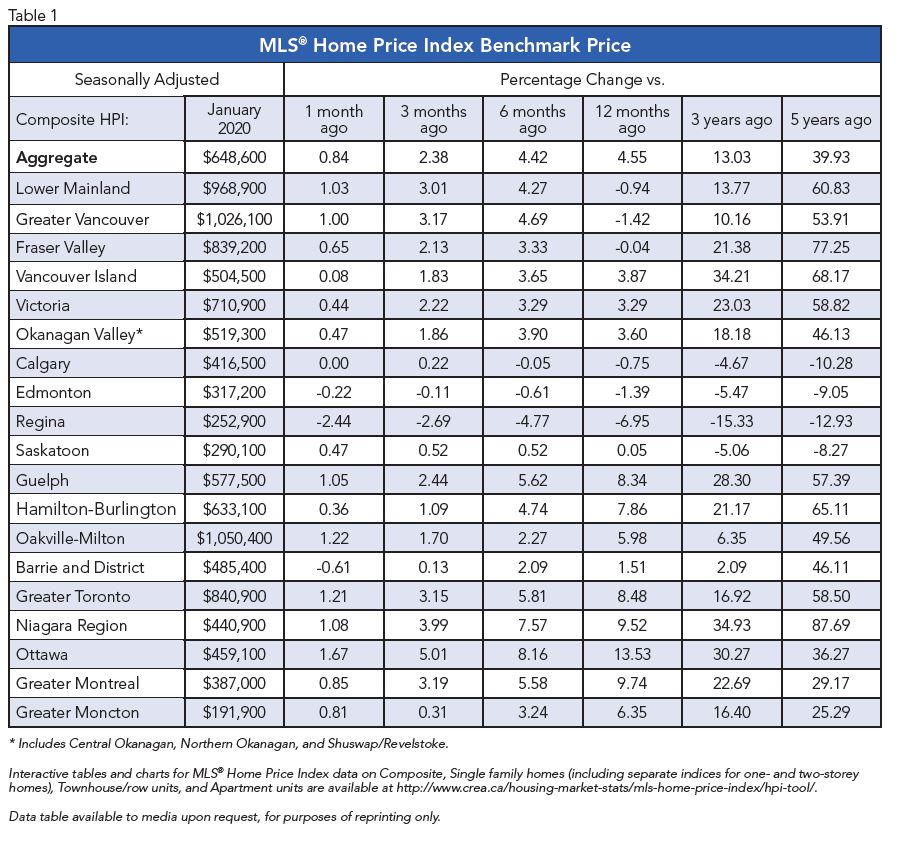
The MLS® HPI in January was up from the previous month in 14 of the 18 markets tracked by the index. (Table 1)

Home price trends have generally been stabilizing in most Prairie markets in recent months following lengthy declines. Meanwhile, prices are clearly on the rise again in British Columbia and in Ontario’s Greater Golden Horseshoe (GGH). Further east, price growth in Ottawa, Montreal and Moncton continues as it has for some time now, with Montreal and particularly Ottawa having strengthened noticeably in recent months.

Comparing home prices to year-ago levels yields considerable variations across the country, although for the most part trends are still regionally split along east/west lines, with rising gains from Ontario east, and a mixed bag of smaller gains and declines in B.C. and the Prairies.

The actual (not seasonally adjusted) Aggregate Composite MLS® (HPI) rose 4.7% y-o-y in January, the biggest year-over-year gain since February 2018.

Home prices in Greater Vancouver (-1.2%) remain slightly below year-ago levels, but declines are still shrinking. Meanwhile, January saw prices back in positive y-o-y territory in the Fraser Valley (+0.3%). Elsewhere in British Columbia, home prices logged y-o-y increases in the Okanagan Valley (+3.5%), Victoria (+3.4%) and elsewhere on Vancouver Island (+4%).

Calgary, Edmonton and Saskatoon continued to post small y-o-y price declines, while the y-o-y gap has now widened to -6.9% in Regina.

In Ontario, home price growth has re-accelerated across most of the GGH, with a number of markets getting close to double digits. Meanwhile, price gains in recent years have continued uninterrupted in Ottawa (+13.7%), Montreal (+9.8%) and Moncton (+6.4%).

All benchmark home categories tracked by the index accelerated further into positive territory on a y-o-y basis, with similar sized gains among the different property types.

Apartment unit prices posted the biggest y-o-y increase (+5%) followed closely by two-storey single family homes (+4.8%), one-storey single-family homes (+4.4%) and townhouse/row units (+4.2%).

The MLS® HPI provides the best way to gauge price trends, because averages are strongly distorted by changes in the mix of sales activity from one month to the next.

The actual (not seasonally adjusted) national average price for homes sold in January 2020 was around $504,350, up 11.2% from the same month the previous year. This was the largest increase since mid-2016.

The national average price is heavily influenced by sales in the GVA and GTA, two of Canada’s most active and expensive housing markets. Excluding these two markets from calculations cuts close to $110,000 from the national average price, trimming it to around $395,000.

– 30 –

PLEASE NOTE: The information contained in this news release combines both major market and national sales information from MLS® Systems from the previous month.

CREA cautions that average price information can be useful in establishing trends over time, but does not indicate actual prices in centres comprised of widely divergent neighbourhoods or account for price differential between geographic areas. Statistical information contained in this report includes all housing types.

MLS® Systems are co-operative marketing systems used only by Canada’s real estate Boards to ensure maximum exposure of properties listed for sale.

The Canadian Real Estate Association (CREA) is one of Canada’s largest single-industry associations, representing more than 130,000 REALTORS® working through 90 real estate boards and associations.

Further information can be found at http://crea.ca/statistics.

For more information, please contact:
Pierre Leduc, Media Relations
The Canadian Real Estate Association
Tel.: 613-237-7111 or 613-884-1460
E-mail: [email protected]

< Back to Newsroom

CREA’s Chief Economist, Gregory Klump, retires after 28 years

Ottawa, ON, February 11, 2020 –  Gregory Klump, CREA’s Chief Economist, has retired from The Canadian Real Estate Association after 28 years.

Greg Klump

Klump joined CREA in 1992, serving as staff economist for the Association. Promoted to Chief Economist in 2005, he grew CREA’s economic and data team into an authoritative source of Canadian real estate data and market analysis.

Klump was instrumental in the development of the MLS® Home Price Index (MLS HPI®). He was a member of CMHC’s National Housing Research Committee as well as a contributor to the Economic Research Committee of the Canadian Home Builders Association.

CREA wishes Gregory Klump all the best in his future endeavors.

– 30 –

About The Canadian Real Estate Association
The Canadian Real Estate Association (CREA) is one of Canada’s largest single-industry associations. CREA works on behalf of more than 130,000 REALTORS® who contribute to the economic and social well-being of communities across Canada. Together they advocate for property owners, buyers and sellers.

For more information, please contact:
Pierre Leduc, Media Relations
The Canadian Real Estate Association
Tel.: 613-237-7111 or 613-884-1460
E-mail: [email protected]­

< Back to Newsroom

Canadian home sales inch lower in December

Ottawa, ON, January 15, 2020 – Statistics released today by the Canadian Real Estate Association (CREA) show national home sales eased between November and December 2019.

Highlights:

  • National home sales declined by 0.9% on a month-over-month (m-o-m) basis in December.
  • Actual (not seasonally adjusted) activity was up 22.7% year-over-year (y-o-y).
  • The number of newly listed properties dropped by a further 1.8% m-o-m.
  • The MLS® Home Price Index (HPI) advanced by 0.8% m-o-m and 3.4% y-o-y.
  • The actual (not seasonally adjusted) national average sale price climbed 9.6% y-o-y.

Home sales recorded over Canadian MLS® Systems edged down 0.9% in December 2019, ending a streak of monthly gains that began last March. Activity is currently about 18% above the six-year low reached in February 2019 but ends the year about 7% below the heights recorded in 2016 and 2017.

There was an almost even split between the number of local markets where activity rose and those where it declined, with higher sales in the Lower Mainland of British Columbia, Calgary and Montreal offsetting declines in the Greater Toronto Area (GTA) and Ottawa.

Actual (not seasonally adjusted) activity was up 22.7% compared to a quiet month of December in 2018. Transactions surpassed year-ago levels across most of Canada, including all of the largest urban markets.

“Home price growth is picking up in housing markets where listings are in short supply,” said Jason Stephen, president of CREA. “Meanwhile, the mortgage stress-test continues to sideline potential home buyers where supply is ample. All real estate is local, and nobody knows that better than a professional REALTOR®, your best source for information and guidance when negotiating the sale or purchase of a home,” said Stephen.

“The momentum for home price gains picked up as last year came to a close,” said Gregory Klump, CREA’s Chief Economist. “If the recent past is prelude, then price trends in British Columbia, the GTA, Ottawa and Montreal look set to lift the national result this year, despite the continuation of a weak pricing environment among housing markets across the Prairie region.”

The number of newly listed homes slid a further 1.8% in December, leaving new supply close to its lowest level in a decade. December’s decline was driven mainly by fewer new listings in the GTA and Ottawa–the same markets most responsible for the decline in sales. Listings available for purchase are now running at a 12-year low. The number of housing markets with a shortage of listings is on the rise; should current trends persist, fewer available listings will likely increasingly weigh on sales activity.

With new listings having declined by more than sales, the national sales-to-new listings ratio further tightened to 66.9% in December 2019 – the highest reading since the spring of 2004. The long-term average for this measure of housing market balance is 53.7%. Barring an unforeseen change in recent trends for the balance between the supply and demand for homes, price gains appear poised to accelerate in 2020.

Considering the degree and duration to which market balance readings are above or below their long-term averages is the best way of gauging whether local housing market conditions favour buyers or sellers. Market balance measures that are within one standard deviation of their long-term average are generally consistent with balanced market conditions.

Based on a comparison of the sales-to-new listings ratio with the long-term average, just over half of all local markets were in balanced market territory in December 2019. That list still includes Greater Vancouver (GVA) but no longer includes the GTA, where market balance favours sellers in purchase negotiations. By contrast, an oversupply of homes relative to demand across much of Alberta and Saskatchewan means sales negotiations remain tilted in favour of buyers. Meanwhile, an ongoing shortage of homes available for purchase across most of Ontario, Quebec and the Maritime provinces means sellers there hold the upper hand in sales negotiations.

The number of months of inventory is another important measure of the balance between sales and the supply of listings. It represents how long it would take to liquidate current inventories at the current rate of sales activity.

There were 4.2 months of inventory on a national basis at the end of December 2019 – the lowest level recorded since the summer of 2007. This measure of market balance has been falling further below its long-term average of 5.3 months. While still within balanced market territory, its current reading suggests that sales negotiations are becoming increasingly tilted in favour of sellers.

National measures of market balance continue to mask significant and increasing regional variations. The number of months of inventory has swollen far beyond long-term averages in Prairie provinces and Newfoundland & Labrador, giving homebuyers ample choice in these regions. By contrast, the measure is running well below long-term averages in Ontario, Quebec and Maritime provinces, resulting in increased competition among buyers for listings and providing fertile ground for price gains. The measure is still within balanced market territory in British Columbia but is becoming increasingly tilted in favour of sellers.

The Aggregate Composite MLS® Home Price Index (MLS® HPI) rose 0.8%, marking its seventh consecutive monthly gain. It is now up 4.7% from last year’s lowest point reached in May and has toppled all previous records in each of the past five months. (Chart B)

The MLS® HPI in December was up from the previous month in 14 of the 18 markets tracked by the index.

Home price trends have generally been stabilizing in the Prairies in recent months following lengthy declines but are clearly on the rise again in British Columbia and in Ontario’s the Greater Golden Horseshoe (GGH). Further east, price growth in Ottawa and Montreal has been ongoing for some time and strengthened toward the end of 2019.

Comparing home prices to year-ago levels yields considerable variations across the country, although for the most part has been regionally split along east/west lines, with declines in the Lower Mainland and major Prairie markets and gains in central and eastern Canada.

The actual (not seasonally adjusted) Aggregate Composite MLS® (HPI) rose 3.4% y-o-y in December 2019, the biggest year-over-year gain since March 2018.

Home prices in Greater Vancouver (-3.1%) and the Fraser Valley (-2%) remain below year-ago levels, but declines are shrinking. Elsewhere in British Columbia, home prices logged y-o-y increases in the Okanagan Valley (+4.2%), Victoria (+2.3%) and elsewhere on Vancouver Island (+4.2%).

Calgary, Edmonton and Saskatoon posted y-o-y price declines of around -1% to -2%, while the gap has widened to -4.6% in Regina.

In Ontario, home price growth has re-accelerated well above consumer price inflation across most of the GGH. Meanwhile, price gains in recent years have continued uninterrupted in Ottawa, Montreal and Moncton.

All benchmark home categories tracked by the index accelerated further into positive territory on a y-o-y basis. One-storey single-family home prices posted the biggest increase (3.6%) followed closely by apartment units (3.4%) and two-storey single family homes (3.3%). Townhouse/row unit prices climbed a slightly more modest 2.7% compared to December 2018.

The MLS® HPI provides the best way to gauge price trends, because averages are strongly distorted by
changes in the mix of sales activity from one month to the next.

The actual (not seasonally adjusted) national average price for homes sold in December 2019 was around $517,000, up 9.6% from the same month the previous year.

The national average price is heavily skewed by sales in the GVA and GTA, two of Canada’s most active and expensive housing markets. Excluding these two markets from calculations cuts more than $117,000 from the national average price, trimming it to around $400,000 and reducing the y-o-y gain to 6.7%.

– 30 –

PLEASE NOTE: The information contained in this news release combines both major market and national sales information from MLS® Systems from the previous month.

CREA cautions that average price information can be useful in establishing trends over time, but does not indicate actual prices in centres comprised of widely divergent neighbourhoods or account for price differential between geographic areas. Statistical information contained in this report includes all housing types.

MLS® Systems are co-operative marketing systems used only by Canada’s real estate Boards to ensure maximum exposure of properties listed for sale.

The Canadian Real Estate Association (CREA) is one of Canada’s largest single-industry trade associations, representing more than 130,000 REALTORS® working through 90 real estate boards and associations.

Further information can be found at http://crea.ca/statistics.

For more information, please contact:
Pierre Leduc, Media Relations
The Canadian Real Estate Association
Tel.: 613-237-7111 or 613-884-1460

< Back to Newsroom

Canadian home sales edge higher in November

Ottawa, ON, December 16, 2019 – Statistics released today by the Canadian Real Estate Association (CREA) show national home sales continued to edge higher in November 2019.

Highlights:

  • National home sales rose 0.6% month-over-month (m-o-m) basis in November.
  • Actual (not seasonally adjusted) activity was up 11.3% year-over-year (y-o-y).
  • The number of newly listed properties dropped by 2.7% m-o-m.
  • The MLS® Home Price Index (HPI) advanced by 0.8% m-o-m and 2.6% y-o-y.
  • The actual (not seasonally adjusted) national average sale price climbed 8.4% y-o-y.

Home sales recorded via Canadian MLS® Systems inched up by 0.6% November 2019. Notching its ninth straight monthly gain, activity stands 20% above the six-year low reached in February 2019 but 6% to 7% below heights recorded in 2016 and 2017.

There was an almost even split between the number of local markets where activity rose and those where it declined. Higher sales across much of British Columbia and in the Greater Toronto Area (GTA) offset a decline in activity in Calgary.

Actual (not seasonally adjusted) activity was up 11.3% year-over-year in November. Transactions surpassed year-ago levels in almost all of Canada’s largest urban markets.

“Sales continue to improve in some regions and not so much in others,” said Jason Stephen, president of CREA. “The mortgage stress-test doesn’t help relieve the ongoing shortage of housing in markets where sales have improved, and it continues to hammer housing demand in markets with ample supply. All real estate is local, and nobody knows that better than a professional REALTOR®, your best source for information and guidance when negotiating the sale or purchase of a home,” said Stephen.

“Home prices look set to continue rising in housing markets where sales are recovering amid an ongoing shortage of supply,” said Gregory Klump, CREA’s Chief Economist. “By the same token, home prices will likely continue trending lower in places where there’s a significant overhang of supply, perpetuated in part by the B-20 mortgage stress-test that continues to sideline homebuyers there.”

The number of newly listed homes slid a further 2.7%, putting them among the lowest levels posted in the past decade. November’s decline was driven primarily by fewer new listings in the GTA.

Slightly higher sales and a drop in new listings further tightened the national sales-to-new listings ratio to 66.3%, which is well above the long-term average of 53.7%. If current trends continue, the balance between supply and demand makes further home price gains likely.

Considering the degree and duration to which market balance readings are above or below their long-term averages is the best way of gauging whether local housing market conditions favour buyers or sellers. Market balance measures that are within one standard deviation of their long-term average are generally consistent with balanced market conditions.

Based on a comparison of the sales-to-new listings ratio with the long-term average, just over half of all local markets were in balanced market territory in November. That list includes the GTA and Lower Mainland of British Columbia, but market balance there is tightening. By contrast, an oversupply of homes relative to demand across much of Alberta and Saskatchewan means sales negotiations remain tilted in favour of buyers.

Meanwhile, an ongoing shortage of supply of homes available for purchase across most of Ontario, Quebec and the Maritime provinces means sellers there hold the upper hand in sales negotiations. The number of months of inventory is another important measure of the balance between sales and the supply of listings. It represents how long it would take to liquidate current inventories at the current rate of sales activity.

There were just 4.2 months of inventory on a national basis at the end of November 2019 – the lowest level recorded since the summer of 2007. This measure of market balance has been retreating further below its long-term average of 5.3 months. While still just within balanced market territory, its current reading suggests that sales negotiations are becoming increasingly tilted in favour of sellers.

National measures of market balance continue to mask significant and increasing regional variations. The number of months of inventory has swollen far beyond long-term averages in Prairie provinces and Newfoundland & Labrador, giving homebuyers ample choice in these regions. By contrast, the measure is running well below long-term averages in Ontario, Quebec and Maritime provinces, resulting in increased competition among buyers for listings and providing fertile ground for price gains. The measure is still within balanced market territory in the Lower Mainland of British Columbia but is becoming increasingly tilted in favour of sellers.

The Aggregate Composite MLS® Home Price Index (MLS® HPI) rose 0.8%. Marking its sixth consecutive monthly gain, it now stands almost 4% above its low point reached last May.

The MLS® HPI in November was up from the previous month in 14 of the 18 markets tracked by the index.

Home price trends have generally been stabilizing in the Prairies in recent months.

While that remains the case in Calgary, Edmonton and Saskatoon, prices in Regina have again moved lower. By contrast, home price trends have clearly started to recover in the Lower Mainland of British Columbia. Meanwhile, prices continue to rebound in the Greater Golden Horseshoe (GGH) region while continuing to trend higher in housing markets to the east of it.

Comparing home prices to year-ago levels yields considerable variations across the country, with a mix of gains and declines in western Canada together with price gains in eastern Canada.

The actual (not seasonally adjusted) Aggregate Composite MLS® (HPI) was up 2.6% y-o-y in November 2019, the biggest year-over-year gain since March 2018.

Home prices in Greater Vancouver (-4.6%) and the Fraser Valley (-2.9%) remain below year-ago levels but declines are shrinking. Elsewhere in British Columbia, home prices logged y-o-y increases in the Okanagan Valley (+1.4%), Victoria (+1.5%) and elsewhere on Vancouver Island (+2.8%).

Calgary, Edmonton and Saskatoon posted price declines of around -2% y-o-y, while the gap widened to-5.5% y-o-y in Regina.

In Ontario, price growth has re-accelerated well ahead of overall consumer price inflation across most of the GGH. Meanwhile, price growth in recent years has continued uninterrupted in Ottawa, Montreal and Moncton.

All benchmark home categories tracked by the index accelerated further into positive territory on a y-o-y basis. Two-storey single-family home prices posted the biggest increase, rising 2.8% y-o-y. Price gains were almost as strong for apartment units (+2.6% y-o-y) and one-storey single family homes (+2.5% y o y), while townhouse/row prices climbed a more modest 1.5% compared to November 2018.

The MLS® HPI provides the best way to gauge price trends, because averages are strongly distorted by changes in the mix of sales activity from one month to the next.

The actual (not seasonally adjusted) national average price for homes sold in November 2019 was around $529,000, up 8.4% from the same month last year.

The national average price is heavily skewed by sales in the GVA and GTA, two of Canada’s most active and expensive housing markets. Excluding these two markets from calculations cuts almost $125,000 from the national average price, trimming it to around $404,000 and reducing the year-over-year gain to 6.9%.

– 30 –

PLEASE NOTE: The information contained in this news release combines both major market and national sales information from MLS® Systems from the previous month.

CREA cautions that average price information can be useful in establishing trends over time, but does not indicate actual prices in centres comprised of widely divergent neighbourhoods or account for price differential between geographic areas. Statistical information contained in this report includes all housing types.

MLS® Systems are co-operative marketing systems used only by Canada’s real estate Boards to ensure maximum exposure of properties listed for sale.

The Canadian Real Estate Association (CREA) is one of Canada’s largest single-industry trade associations, representing more than 130,000 REALTORS® working through 90 real estate boards and associations.

Further information can be found at http://crea.ca/statistics.

For more information, please contact:

Pierre Leduc, Media Relations
The Canadian Real Estate Association
Tel.: 613-237-7111 or 613-884-1460

< Back to Newsroom

Canadian home sales hold steady in October

Ottawa, ON, November 15, 2019 – Statistics released today by the Canadian Real Estate Association (CREA) show national home sales were unchanged from September to October 2019.

Highlights:

  • National home sales held steady on a month-over-month (m-o-m) basis in October.
  • Actual (not seasonally adjusted) activity was up 12.9% year-over-year (y-o-y).
  • The number of newly listed properties declined by 1.8% m-o-m.
  • The MLS® Home Price Index (HPI) advanced by 0.6% m-o-m and 1.8% y-o-y.
  • The actual (not seasonally adjusted) national average sale price climbed 5.8% y-o-y.

Home sales recorded via Canadian MLS® Systems remained steady in October 2019 following a string of monthly increases that began in March. Activity is now almost 20% above the six-year low reached in February 2019 but remains 7% below heights reached in 2016 and 2017. (Chart A)

There was an almost even split between the number of local markets where activity rose and those where it declined. Higher sales in Greater Vancouver (GVA), the neighbouring Fraser Valley and Ottawa offset a monthly decline in activity in the Greater Toronto Area (GTA)—particularly in Central Toronto—and Hamilton-Burlington.

Actual (not seasonally adjusted) activity rose 12.9% year-over-year. Transactions were up from year-ago levels in 80% of all local markets in October, including all of Canada’s largest urban markets.

“Steady national activity in October hides how the mortgage stress-test remains a drag on many local housing markets where the balance between supply and demand favours homebuyers in purchase negotiations,” said Jason Stephen, president of CREA. “That said, all real estate is local, so market balance varies depending on location, housing type, and price segment. Nobody knows that better than a professional REALTOR®, your best source for information and guidance when negotiating the sale or purchase of a home,” said Stephen.

“It’s a full-blown buyer’s market or on the cusp of one in a number of housing markets across the Prairies and in Newfoundland,” said Gregory Klump, CREA’s Chief Economist. “Homebuyers there have the upper hand in purchase negotiations and the mortgage stress-test has contributed to that by reducing the number of competing buyers who can qualify for mortgage financing while market conditions are in their favour.”

The number of newly listed homes fell by 1.8% in October, with the GTA and Ottawa posting the largest declines. Almost a third of all housing markets posted a monthly decline of at least 5%, while about a fifth of all markets posted a monthly increase of at least 5%.

Steady sales and fewer new listings further tightened the national sales-to-new listings ratio to 63.7%. This measure has been increasingly rising above its long-term average of 53.6%. Its current reading suggests that sales negotiations are becoming increasingly tilted in favour of sellers; however, the national measure continues to mask significant regional variations.

Considering the degree and duration to which market balance readings are above or below their long-term averages is the best way of gauging whether local housing market conditions favour buyers or sellers. Market balance measures that are within one standard deviation of their long-term average are generally consistent with balanced market conditions.

Based on a comparison of the sales-to-new listings ratio with the long-term average, just over two-thirds of all local markets were in balanced market territory in October 2019, including the GTA and Lower Mainland of British Columbia. Nonetheless, sales negotiations remain tilted in favour of buyers in housing markets located in Alberta, Saskatchewan and Newfoundland & Labrador.

The number of months of inventory is another important measure of the balance between sales and the supply of listings. It represents how long it would take to liquidate current inventories at the current rate of sales activity.

There were 4.4 months of inventory on a national basis at the end of October 2019—the lowest level recorded since April 2017. This measure of market balance has been retreating further below its long-term average of 5.3 months. While still within balanced market territory, its current reading suggests that sales negotiations are becoming increasingly tilted in favour of sellers.

National measures of market balance continue to mask significant regional variations. The number of months of inventory has swollen far beyond long-term averages in Prairie provinces and Newfoundland & Labrador, giving homebuyers ample choice in these regions. By contrast, the measure is running well

below long-term averages in Ontario, Quebec and Maritime provinces, resulting in increased competition among buyers for listings and providing fertile ground for price gains. The measure is still well centred within balanced market territory in the Lower Mainland of British Columbia.

The Aggregate Composite MLS® Home Price Index (MLS® HPI) rose 0.6%, marking its fifth consecutive monthly gain. (Chart B)

Seasonally adjusted MLS® HPI readings in October were up from the previous month in 14 of the 18 markets tracked by the index. (Table 1)

Recently, home price trends have generally been stabilizing in the Lower Mainland and the Prairies. While that remains the case in Calgary and Saskatoon, home prices in Edmonton and Regina have moved lower. By contrast, home price trends have started to recover in the GVA and the neighbouring Fraser Valley.

Meanwhile, price growth continues to rebound in the Greater Golden Horseshoe (GGH). In markets further east, price growth has been trending higher for the last three or four years.

Comparing home prices to year-ago levels yields considerable variations across the country, with mostly declines in western Canada and mostly price gains in eastern Canada.

The actual (not seasonally adjusted) Aggregate Composite MLS® (HPI) was up 1.8% y-o-y in October 2019, the biggest year-over-year gain since November 2018.

Home prices in the GVA (-6.4%) and the Fraser Valley (-4.2%) are still below year-ago levels, although declines are becoming smaller.

Elsewhere in British Columbia, home prices logged y-o-y increases on Vancouver Island and in the Okanagan Valley (3.1% and 2%, respectively) while having edged marginally higher in Victoria (0.5% y-o-y).

Calgary, Edmonton and Saskatoon posted price declines in the range of -1.5% to -2.5% on a y-o-y basis in October, while the gap between this year and last year widened sharply to -6.8% in Regina.

In Ontario, price growth has re-accelerated well ahead of overall consumer price inflation across most of the GGH. Meanwhile, price growth in recent years has continued uninterrupted in Ottawa, Montreal and Moncton.

All benchmark home categories tracked by the index remained in positive y-o-y territory in October 2019. Two-storey single-family home prices were up most, rising 2.5% y-o-y. One-storey single family home prices rose 1.4% y-o-y, while townhouse/row and apartment units climbed by 1% and 1.2%, respectively.

The MLS® HPI provides the best way to gauge price trends, because averages are strongly distorted by changes in the mix of sales activity from one month to the next.

The actual (not seasonally adjusted) national average price for homes sold in October 2019 was around $525,000, up 5.8% from the same month last year.

The national average price is heavily skewed by sales in the GVA and GTA, two of Canada’s most active and expensive housing markets. Excluding these two markets from calculations cuts almost $125,000 from the national average price, trimming it to around $400,000 and reducing the year-over-year gain to 4.7%.

– 30 –

PLEASE NOTE: The information contained in this news release combines both major market and national sales information from MLS® Systems from the previous month.

CREA cautions that average price information can be useful in establishing trends over time, but does not indicate actual prices in centres comprised of widely divergent neighbourhoods or account for price differential between geographic areas. Statistical information contained in this report includes all housing types.

MLS® Systems are co-operative marketing systems used only by Canada’s real estate Boards to ensure maximum exposure of properties listed for sale.

The Canadian Real Estate Association (CREA) is one of Canada’s largest single-industry trade associations, representing more than 130,000 REALTORS® working through 90 real estate boards and associations.

Further information can be found at http://crea.ca/statistics.

For more information, please contact:

Pierre Leduc, Media Relations
The Canadian Real Estate Association
Tel.: 613-237-7111 or 613-884-1460

< Back to Newsroom

Canadian home sales rise again in September

Ottawa, ON, October 15, 2019 – Statistics released today by the Canadian Real Estate Association (CREA) show national home sales were up slightly in September 2019.

Highlights:

  • National home sales rose 0.6% month-over-month (m-o-m) in September.
  • Actual (not seasonally adjusted) activity was up 15.5% year-over-year (y-o-y).
  • The number of newly listed properties edged back by 0.6% m-o-m.
  • The MLS® Home Price Index (HPI) advanced by 0.5% m-o-m and 1.3% y-o-y.
  • The actual (not seasonally adjusted) national average sale price was up 5.3% y-o-y.

Home sales recorded via Canadian MLS® Systems advanced for the seventh consecutive month, raising them 18% above the six-year low reached in February 2019 but leaving them about 8% below highs reached in 2016 and 2017. (Chart A)

Activity was up in slightly more than half of all local markets, led by Greater Vancouver (GVA) and the Fraser Valley (which together constitute the Lower Mainland of British Columbia).

Actual (not seasonally adjusted) sales activity was up 15.5% year-over-year, reflecting the combination of slow sales in September 2018 and a rebound in activity this year. Transactions were up from year-ago levels in all of Canada’s largest urban markets, including the Lower Mainland of British Columbia, Calgary, Edmonton, Winnipeg, the Greater Toronto area (GTA), Hamilton-Burlington, Ottawa and Montreal.

“National sales activity has begun to rebound in recent months,” said Jason Stephen, president of CREA. “That said, all real estate is local, so there’s a lot of variation in the strength of the rebound depending on the housing type, location and price segment. Nobody knows that better than a professional REALTOR®, your best source for information and guidance when negotiating the sale or purchase of a home,” said Stephen.

“Home sales activity and prices are improving after having weakened significantly in a number of housing markets,” said Gregory Klump, CREA’s Chief Economist. “How long the current rebound continues depends on economic growth, which is being subdued by trade and business investment uncertainties.”

The number of newly listed homes edged back by 0.6%. The small increase in sales combined with the small decline in new supply tightened the national sales-to-new listings ratio to 61.3% in September. This measure has been increasingly rising above its long-term average of 53.6%. At this point, this measure remains in balanced market territory, but is favouring sellers more than buyers.

Considering the degree and duration to which market balance readings are above or below their long-term averages is the best way of gauging whether local housing market conditions favour buyers or sellers. Market balance measures that are within one standard deviation of their long-term average are generally consistent with balanced market conditions.

Based on a comparison of the sales-to-new listings ratio with the long-term average, three-quarters of all local markets were in balanced market territory in September 2019, including the GTA and Lower Mainland of British Columbia. Of the remainder, the ratio was in sellers market territory in all housing markets except Saskatoon and Southeast Saskatchewan.

The number of months of inventory is another important measure of the balance between sales and the supply of listings. It represents how long it would take to liquidate current inventories at the current rate of sales activity.

There were 4.5 months of inventory on a national basis at the end of September 2019 – the lowest level recorded since December 2017. This measure of market balance has been increasingly retreating below its long-term average of 5.3 months.

As with the sales-to-new listings ratio, the number of months of inventory is still within balanced market territory but tilting in favour of sellers; however, national measures of market balance continue to mask significant regional variations.

The number of months of inventory has swollen far beyond long-term averages in Prairie provinces and Newfoundland & Labrador, giving homebuyers ample choice in these regions. By contrast, the measure is running well below long-term averages in Ontario, Quebec and Maritime provinces, resulting in increased competition among buyers for listings and providing fertile ground for price gains. Meanwhile, the measure is well centered within balanced market territory in the Lower Mainland of British Columbia, making it likely that prices there will continue to stabilize.

The Aggregate Composite MLS® Home Price Index (MLS® HPI) rose 0.5% m-o-m in September 2019, marking a fourth consecutive gain for the measure.

Seasonally adjusted MLS® HPI readings in September were up from the previous month in 13 of the 18 markets tracked by the index. (Table 1)

In recent months, home prices have generally been stabilizing in the Lower Mainland and the Prairies, where previously they were falling. Meanwhile, price growth has begun to rebound among markets in the Greater Golden Horseshoe (GGH), rejoining the ongoing price gains in housing markets located further east.

Comparing home prices to year-ago levels yields considerable variations across the country, with mostly declines in western Canada and mostly price gains in eastern Canada.

The actual (not seasonally adjusted) Aggregate Composite MLS® (HPI) was up 1.3% y-o-y in September 2019, the biggest year-over-year gain since December 2018. (Chart B)

Home prices in Greater Vancouver and the Fraser Valley remain furthest below year-ago levels, (-7.3% and -4.8%, respectively), although declines are becoming smaller. Elsewhere in British Columbia, home prices on Vancouver Island and in the Okanagan Valley logged y-o-y increases (4% and 1.1%, respectively) while they edged slightly higher in Victoria (+0.4% y-o-y).

Prairie markets posted price declines ranging from about 1% to around 4% on a y-o-y basis in September, while y-o-y price growth has re-accelerated well ahead of overall consumer price inflation across most of the GGH. Meanwhile, price growth in recent years has continued uninterrupted in Ottawa, Montreal and Moncton.

All benchmark home categories tracked by the index returned to positive y-o-y territory in August 2019 and gains further increased in September. Two-storey single-family home prices were up most, rising 1.7% y-o-y. One-storey single family home prices rose 1.4% y-o-y, while townhouse/row and apartment units edged up 0.4% and 0.7%, respectively.

The MLS® HPI provides the best way to gauge price trends, because averages are strongly distorted by changes in the mix of sales activity from one month to the next.

The actual (not seasonally adjusted) national average price for homes sold in September 2019 was around $515,500, up 5.3% from the same month last year.

The national average price is heavily skewed by sales in the GVA and GTA, two of Canada’s most active and expensive housing markets. Excluding these two markets from calculations cuts almost $116,000 from the national average price, trimming it to less than $397,000 and reducing the year-over-year gain to 3.3%.

– 30 –

PLEASE NOTE: The information contained in this news release combines both major market and national sales information from MLS® Systems from the previous month.

CREA cautions that average price information can be useful in establishing trends over time, but does not indicate actual prices in centres comprised of widely divergent neighbourhoods or account for price differential between geographic areas. Statistical information contained in this report includes all housing types.

MLS® Systems are co-operative marketing systems used only by Canada’s real estate Boards to ensure maximum exposure of properties listed for sale.

The Canadian Real Estate Association (CREA) is one of Canada’s largest single-industry trade associations, representing more than 130,000 REALTORS® working through 90 real estate boards and associations.

Further information can be found at http://crea.ca/statistics.

For more information, please contact:

Pierre Leduc, Media Relations
The Canadian Real Estate Association
Tel.: 613-237-7111 or 613-884-1460
E-mail: [email protected]

< Back to Newsroom

Altus Group Partners with The Canadian Real Estate Association and its Member Real Estate Boards and Associations to Expand the MLS® Home Price Index Nationally

Advanced AVM technology from Altus Group combined with extensive data from real estate boards and associations delivers first national Canadian index making it one of largest and most comprehensive in the world

TORONTO (October 2, 2019) Altus Group Limited (“Altus Group”) (TSX: AIF), a leading provider of software, data solutions and independent advisory services to the global commercial real estate (“CRE”) industry, together with The Canadian Real Estate Association (“CREA”) and the Founding Boards, including the Greater Vancouver Real Estate Board, the Fraser Valley Real Estate Board, the Calgary Real Estate Board, the Toronto Regional Real Estate Board, and the Quebec Professional Association of Real Estate Brokers, announced the broadening of their partnership to expand CREA’s Multiple Listing Service® (“MLS®”) Home Price Index nationally.

The MLS® Home Price Index is the most advanced and accurate tool relied on by the industry to gauge a neighbourhood’s home price levels and trends. The MLS® Home Price Index was pioneered by CREA and the Founding Boards and leverages Altus Group’s proprietary technology and sophisticated statistical models.

Altus Group developed the technology that powers the MLS® Home Price Index in 2009 which analyzes all of the sales data from a board or association’s MLS® System, applies a value to a “typical” home for various types of dwellings for each submarket, and tracks the relative change in value over time. Through the timely access to data inputs directly from the real estate boards and associations, real estate transactions across the country are captured on a real-time basis to ensure the index values capture market trends and activity to allow for faster insights for realtors and their clients. Leveraging its machine learning expertise along with its proprietary knowledge of automated valuation models (“AVM”) and data cleansing, Altus Group has continued to improve the technology that powers the MLS® Home Price Index and supports its expansion to markets across Canada.

“We’re excited to announce that for the first-time there is an agreement in place for all Canadian real estate boards and associations to join the MLS® Home Price Index and create a truly national housing price index that encompasses all of the housing market activity. Providing all of our members with this level of analysis and visibility into the market trends is invaluable,” said Michael Bourque, CEO of CREA. “We’re pleased to continue and further expand our strategic partnership with Altus Group to deliver greater value to REALTORS® and the Canadian real estate market by providing consistent and reliable insights on a local and national level.”

This new agreement provides a framework to expand the MLS® Home Price Index from the current 18 real estate boards to all of CREA’s 90 real estate boards and associations across Canada, representing more than 130,000 REALTOR® members. The expansion enables CREA and all real estate boards and associations to jointly provide a truly national MLS® Home Price Index for Canada.

“This is a reflection of the success we’ve achieved in our partnership to date, and the combination of machine learning and AVM technology delivers a powerful tool at a scale that brings greater value to everyone across the industry,” said Richard Simon, Managing Director of Data Solutions at Altus Group.

 “This expanded agreement with Altus Group enables us to support REALTORS® with the first truly national Housing Price Index. Having greater access and visibility to data is critical in today’s competitive market and a national MLS® Home Price Index will better equip REALTORS® to address the needs of consumers across all markets,” said Gregory Klump, Chief Economist at CREA.

“This is great news for REALTORS® and their clients,” said Bill Stirling, CEO of the Newfoundland and Labrador Association of REALTORS®. “The MLS® Home Price Index provides the best way to understand how local housing price trends are evolving, and we’re proud to be a part of this.”

About Altus Group Limited
Altus Group Limited is a leading provider of software, data solutions and independent advisory services to the global commercial real estate industry. Our businesses, Altus Analytics and Altus Expert Services, reflect decades of experience, a range of expertise, and technology-enabled capabilities. Our solutions empower clients to analyze, gain insight and recognize value on their real estate investments. Headquartered in Canada, we have approximately 2,500 employees around the world, with operations in North America, Europe and Asia Pacific. Our clients include some of the world’s largest real estate industry participants. Altus Group pays a quarterly dividend of $0.15 per share and our shares are traded on the TSX under the symbol AIF.

For more information on Altus Group, please visit: www.altusgroup.com.

About The Canadian Real Estate Association
The Canadian Real Estate Association (CREA) is one of Canada’s largest single-industry trade associations. CREA works on behalf of more than 130,000 REALTORS® who contribute to the economic and social well-being of communities across Canada. Together they advocate for property owners, buyers and sellers.

FOR FURTHER INFORMATION PLEASE CONTACT:

Altus Group
Jeff Hayward
Vice President, Global Marketing & Communications
416-234-4212
[email protected]

The Canadian Real Estate Association
Pierre Leduc
Media Relations
613-237-7111 or 613-884-1460
[email protected]

< Back to Newsroom

Canadian home sales edge higher in August

Ottawa, ON, September 16, 2019 – Statistics released today by the Canadian Real Estate Association (CREA) show national home sales were up in August 2019.

Highlights:

  • National home sales rose 1.4% month-over-month (m-o-m) in August.
  • Actual (not seasonally adjusted) activity was up 5% year-over-year (y-o-y).
  • The number of newly listed homes climbed 1.1% m-o-m.
  • The MLS® Home Price Index (HPI) advanced by 0.8% m-o-m and 0.9% y-o-y.
  • The actual (not seasonally adjusted) national average sale price was up 3.9% y-o-y.

Home sales recorded via Canadian MLS® Systems advanced for the sixth consecutive month in August. Transactions are now running almost 17% above the six-year low reached in February 2019, but remain about 10% below highs reached in 2016 and 2017. (Chart A)

Activity was up in slightly more than half of all local markets, although monthly changes were generally modest across most of the country. Gains were led by a record-setting August in Winnipeg and a further improvement in the Fraser Valley. Moncton posted the biggest monthly decline in sales, returning to more normal levels after having recently jumped to record heights.

Actual (not seasonally adjusted) sales activity was up 5% from where it stood in August 2018. The number of homes that traded hands was up from year-ago levels in most of Canada’s largest urban markets, including the Lower Mainland of British Columbia, Calgary, Winnipeg, the Greater Toronto (GTA), Ottawa and Montreal.

“The mortgage stress-test has eased marginally and that’s helped some potential homebuyers,” said Jason Stephen, CREA’s President, “but the extent to which they’re adjusting to it continues to vary by community and price segment. All real estate is local. Nobody knows that better than a professional REALTOR®, your best source for information and guidance when negotiating the sale or purchase of a home,” said Stephen.

“The recent marginal decline in the benchmark five-year interest rate used to assess homebuyers’ mortgage eligibility, together with lower home prices in some markets, means that some previously sidelined homebuyers have returned,” said Gregory Klump, CREA’s Chief Economist. “Even so, the mortgage stress-test will continue to limit homebuyers’ access to mortgage financing, with the degree to which it further weighs on home sales activity continuing to vary by region.”

The number of newly listed homes rose 1.1% in August. With sales and new supply up by similar magnitudes, the national sales-to-new listings ratio was 60.1%—little changed from July’s reading of 60.0%. The measure has risen above its long-term average (of 53.6%) in recent months, which indicates a tighter balance between supply and demand and a growing potential for price gains.

Considering the degree and duration to which market balance readings are above or below their long-term averages is the best way of gauging whether local housing market conditions favour buyers or sellers. Market balance measures that are within one standard deviation of their long-term average are generally consistent with balanced market conditions.

Based on a comparison of the sales-to-new listings ratio with the long-term average, about three-quarters of all local markets were in balanced market territory in August 2019. Of the remainder, the ratio was above the long-term average in all markets save for some in the Prairie region.

The number of months of inventory is another important measure of the balance between sales and the supply of listings. It represents how long it would take to liquidate current inventories at the current rate of sales activity.

There were 4.6 months of inventory on a national basis at the end of August 2019 – the lowest level since December 2017. This measure of market balance has been increasingly retreating below its long-term average (of 5.3 months).

That said, national measures of market balance continue to mask significant regional variations. The number of months of inventory has swollen far beyond long-term averages in Prairie provinces and Newfoundland & Labrador, giving homebuyers ample choice in these regions. By contrast, the measure is running well below long-term averages in Ontario, Quebec and Maritime provinces, resulting in increased competition among buyers for listings and fertile ground for price gains. Meanwhile, the measure is well centred in balanced market territory in the Lower Mainland of British Columbia, making it likely that prices there will stabilize.

The Aggregate Composite MLS® Home Price Index (MLS® HPI) rose 0.8% m-o-m in August 2019, the largest increase in over 2 years. (Chart B)

Seasonally adjusted MLS® HPI readings in August were up from the previous month in 14 of the 18 markets tracked by the index, marking the biggest dispersion of monthly price gains since last March. (Table 1)

In recent months, home prices have generally been stabilizing in British Columbia and the Prairies, a measure which had been falling until recently. Meanwhile, price growth has begun to rebound among markets in the Greater Golden Horseshoe (GGH) region amid ongoing price gains in housing markets east of it.

A comparison of home prices to year-ago levels yields considerable variations across the country, with declines in western Canada and price gains in eastern Canada.

The actual (not seasonally adjusted) Aggregate Composite MLS® (HPI) was up 0.9% y-o-y in August 2019. This marks the second consecutive month in which prices climbed above year-ago levels and the largest y-o-y increase since the end of last year.

Home prices in Greater Vancouver (GVA) and the Fraser Valley remain furthest below year-ago levels, (-8.3% and -5.5%, respectively), while Vancouver Island and the Okanagan Valley logged y-o-y increases (3.7% and 1.5% respectively).

Prairie markets posted modest price declines, while y-o-y price growth has re-accelerated ahead of overall consumer price inflation across most of the GGH. Meanwhile, price growth has continued uninterrupted for the last few years in Ottawa, Montreal and Moncton.

All benchmark home categories tracked by the index returned to positive y-o-y territory in August. Two-storey single-family home prices were up most, rising 1.2% y-o-y. One-storey single family home prices rose 0.7% y-o-y, while townhouse/row and apartment unit edged up 0.3% and 0.5%, respectively.

The MLS® HPI provides the best way to gauge price trends, because averages are strongly distorted by changes in the mix of sales activity from one month to the next.

The actual (not seasonally adjusted) national average price for homes sold in August 2019 was around $493,500, up almost 4% from the same month last year.

The national average price is heavily skewed by sales in the GVA and GTA, two of Canada’s most active and expensive housing markets. Excluding these two markets from calculations cuts more than $100,000 from the national average price, trimming it to less than $393,000 and reducing the year-over-year gain to 2.7%.

– 30 –

PLEASE NOTE: The information contained in this news release combines both major market and national sales information from MLS® Systems from the previous month.

CREA cautions that average price information can be useful in establishing trends over time, but does not indicate actual prices in centres comprised of widely divergent neighbourhoods or account for price differential between geographic areas. Statistical information contained in this report includes all housing types.

MLS® Systems are co-operative marketing systems used only by Canada’s real estate Boards to ensure maximum exposure of properties listed for sale.

The Canadian Real Estate Association (CREA) is one of Canada’s largest single-industry trade associations, representing more than 130,000 REALTORS® working through 90 real estate boards and associations.

Further information can be found at http://crea.ca/statistics.

For more information, please contact:

Pierre Leduc, Media Relations
The Canadian Real Estate Association
Tel.: 613-237-7111 or 613-884-1460
E-mail: [email protected]

< Back to Newsroom

Quarterly Forecast

CREA Updates Resale Housing Market Forecast

Ottawa, ON, September 16, 2019 – The Canadian Real Estate Association (CREA) has updated its forecast for home sales activity via the Multiple Listing Service® (MLS®) Systems of Canadian real estate boards and associations – for the rest of 2019 and looking ahead to 2020.

Economic fundamentals underpinning housing activity remain strong outside of the Prairies and Newfoundland and Labrador. Population and employment growth have both remained supportive and the unemployment rate remains low. At the same time, expectations have become widespread that the Bank of Canada is unlikely to raise interest rates over the rest of the year and into next.

More importantly for home buyers and housing markets, longer-term mortgage rates have been declining. Among those that have declined is the Bank of Canada’s benchmark five-year rate used by banks to qualify mortgage applicants.

Additionally, the Federal Government has recently launched its First-Time Home Buyer Incentive, a shared equity program in which the federal government finances a portion of a home purchase in exchange for an equity share of the home’s value.

Of these factors supporting Canadian housing activity, the decline in mortgage rates is arguably the most important development since the release in June of CREA’s most recent forecast. The decline in the benchmark five-year mortgage rate has marginally relaxed the B-20 mortgage stress-test, which has dampened housing activity more than other policy changes made in recent years.

Home sales have improved by more than expected in recent months and there are early signs that home price declines in the Lower Mainland of British Columbia and across the Prairies may be abating. Meanwhile, home prices are re-accelerating across Ontario’s Greater Golden Horseshoe region.

Strong economic fundamentals, previously unexpected declines in mortgage interest rates and stronger than previously expected housing market trends in British Columbia and Ontario have resulted in CREA upwardly revising forecast home sales in 2019 and 2020. Nonetheless, the overall level of national sales activity this year and next is anticipated to remain below levels recorded prior to the implementation of the B-20 stress test.

National home sales are now projected to recover to 482,000 units in 2019, representing a 5% increase from the five-year low recorded in 2018. While this is an upward revision of 19,000 transactions compared to CREA’s previous forecast (85% of which is due to upgraded British Columbia and Ontario forecasts), it represents a return of activity to its 10-year annual average. It also remains well below the annual record set in 2016, when almost 540,000 homes traded hands. Notwithstanding the upward revision, the forecast for 2019 on a per capita basis remains the second weakest since 2001.

British Columbia is expected to continue to weigh on national figures in 2019, with a decline of 5.4% compared to 2018. This is expected to be more than offset by gains in Ontario (+8.3%) and Quebec (+9.7%).

British Columbia, Alberta, Saskatchewan and Newfoundland and Labrador are all forecast to come in at or near multi-year lows in 2019. By contrast, Manitoba, Quebec and New Brunswick are expected to set new annual sales records. Activity in Ontario is forecast to be in line with the 10-year average for the province.

The national average price is still projected to stabilize in 2019, though with a small 0.5% increase compared to the previously forecast 0.6% decline. The national average home price is projected to come in at $491,000 amid diverging trends in eastern and western provinces. In line with the balance between supply and demand across the country, average prices in 2019 are expected to fall in British Columbia, Alberta, Saskatchewan while rising in Ontario, Quebec and the Maritimes. In keeping with an elevated inventory of listings relative to sales, the average price in Newfoundland and Labrador is anticipated to fall for the fifth consecutive year.

Sales are forecast to continue to improve through 2020, albeit slowly. National home sales are forecast to rise by 7.5% to 518,100 units next year, with most of this increase reflecting a weak start to 2019 rather than a significant change in sales trends out to the end of next year. Indeed, an anticipated increase of 14.3% in British Columbia’s sales returns activity in line with the province’s 10-year average.

Ontario and Quebec are predicted to see sales rise by about 7% in 2020, while activity in Alberta will recover by about 5% compared to 2019. The number of homes trading hands in other provinces is predicted to edge up or down only marginally.

The national average price is forecast to advance by 2.1% in 2020 to $501,400, remaining below its 2017 level. Average price trends across Canada in 2020 are generally expected to be more moderate versions of those in 2019, with small declines in Alberta, Saskatchewan and Newfoundland and Labrador, and modest gains in Ontario, Quebec and the Maritimes. In British Columbia, the average home price is expected to stabilize next year following this year’s decline.

– 30 –

About The Canadian Real Estate Association
The Canadian Real Estate Association (CREA) is one of Canada’s largest single-industry associations. CREA works on behalf of more than 130,000 REALTORS® who contribute to the economic and social well-being of communities across Canada. Together they advocate for property owners, buyers and sellers.

For more information, please contact:
Pierre Leduc, Media Relations
The Canadian Real Estate Association
Tel.: 613-237-7111 or 613-884-1460
E-mail: [email protected]

< Back to Newsroom