Canadian home sales rise in July

Ottawa, ON, August 15, 2019 – Statistics released today by the Canadian Real Estate Association (CREA) show national home sales were up in July 2019 compared to June.

Highlights:

  • National home sales rose 3.5% month-over-month (m-o-m) in July.
  • Actual (not seasonally adjusted) activity was up 12.6% year-over-year (y-o-y).
  • The number of newly listed homes edged back 0.4% m-o-m.
  • The MLS® Home Price Index (HPI) climbed 0.6% m-o-m and 0.2% y-o-y.
  • The actual (not seasonally adjusted) national average sale price was up 3.9% y-o-y.

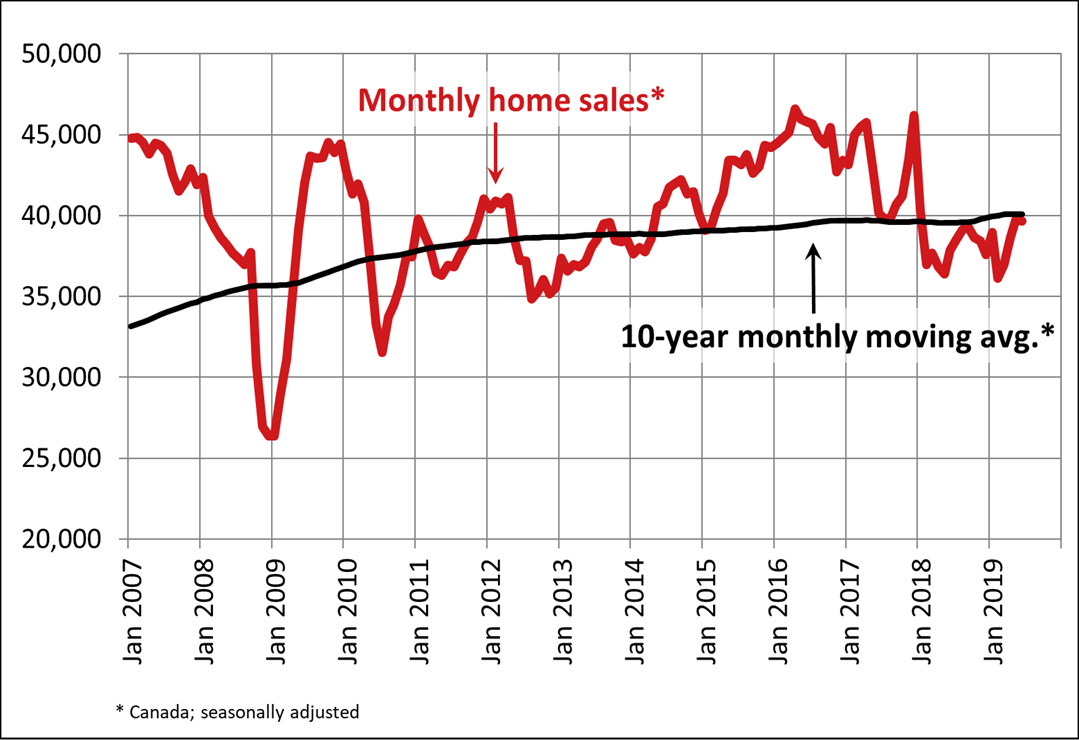
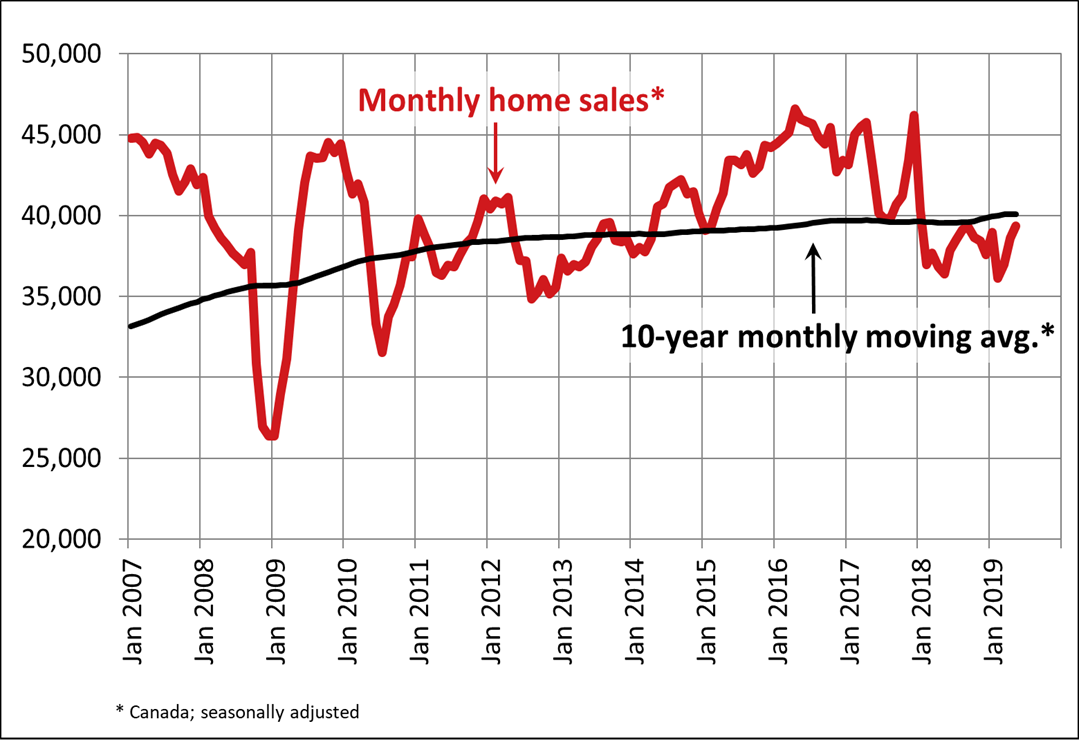
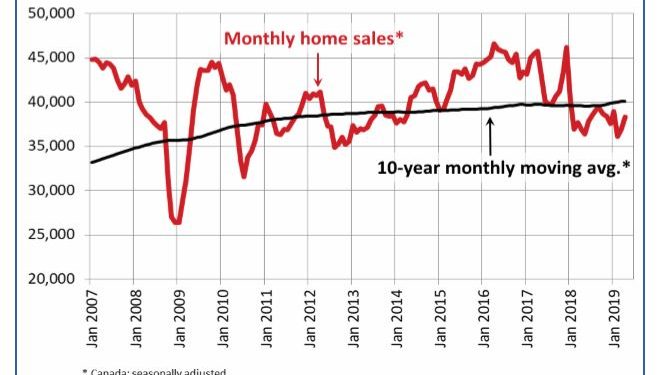
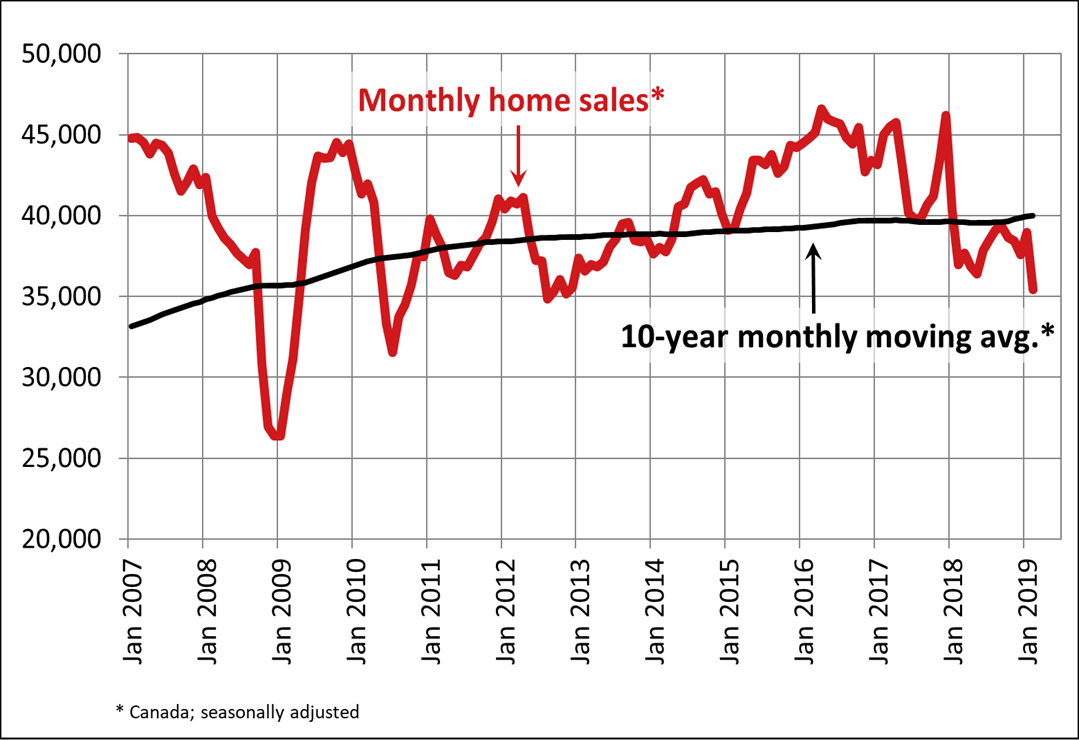
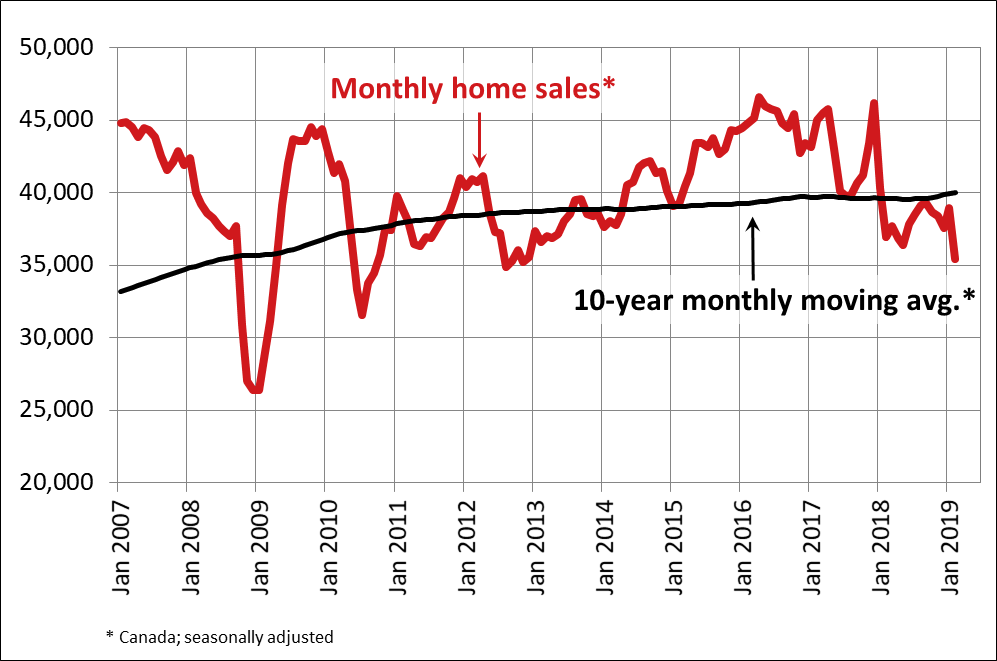
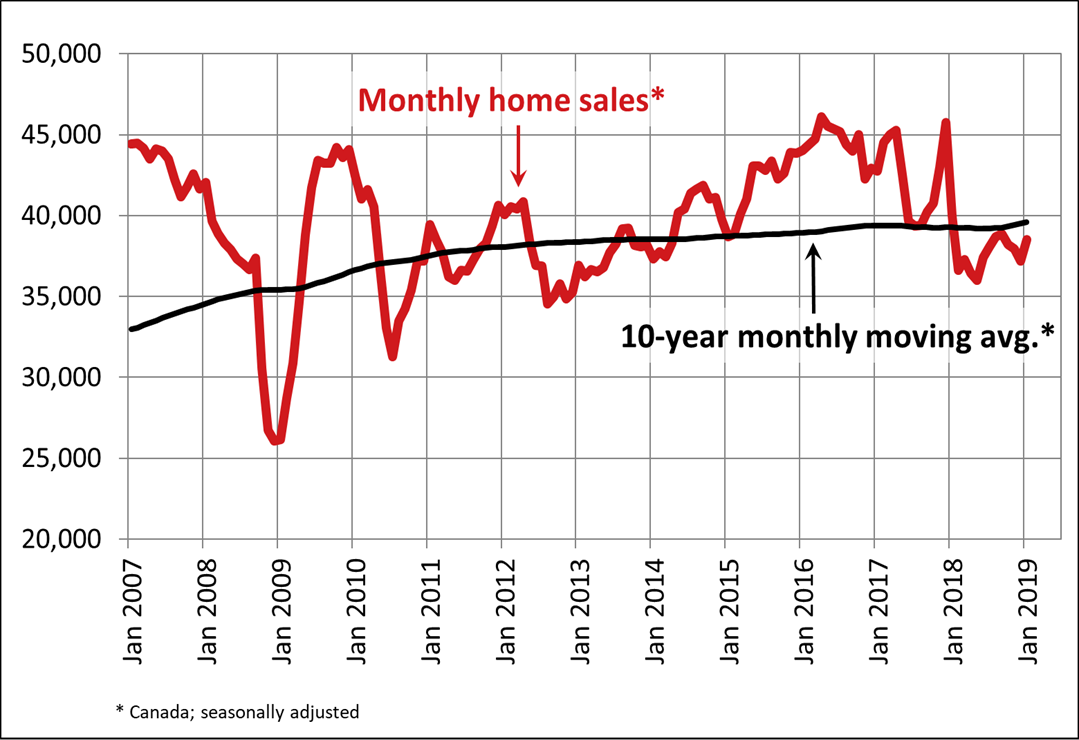
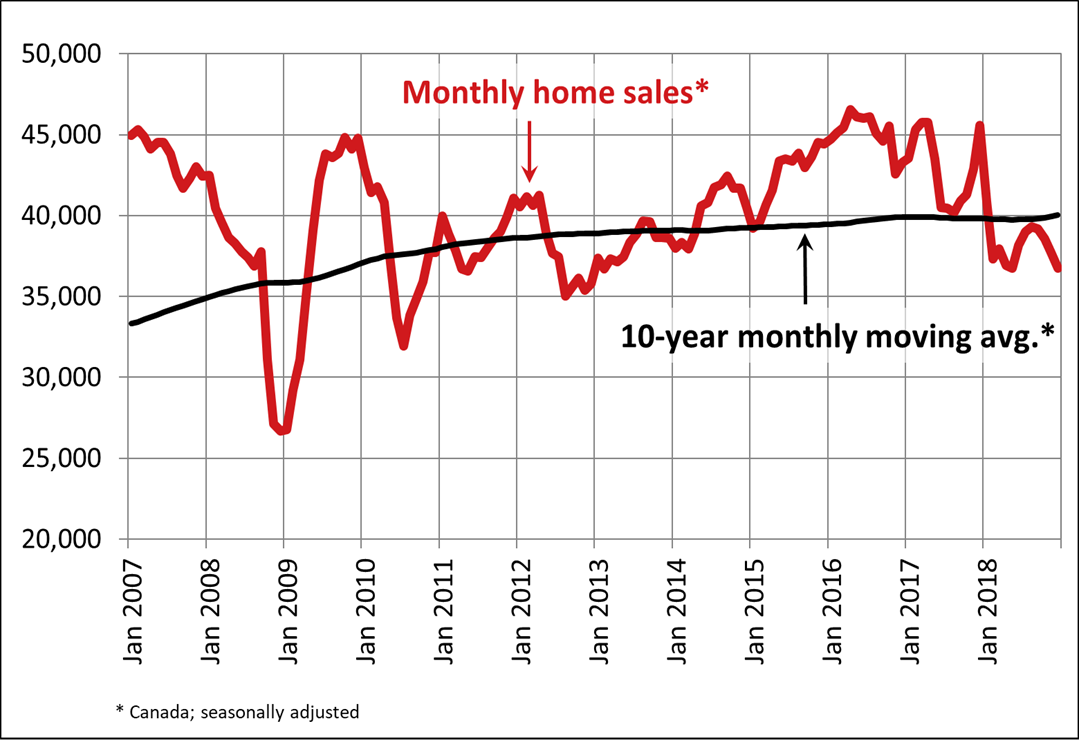
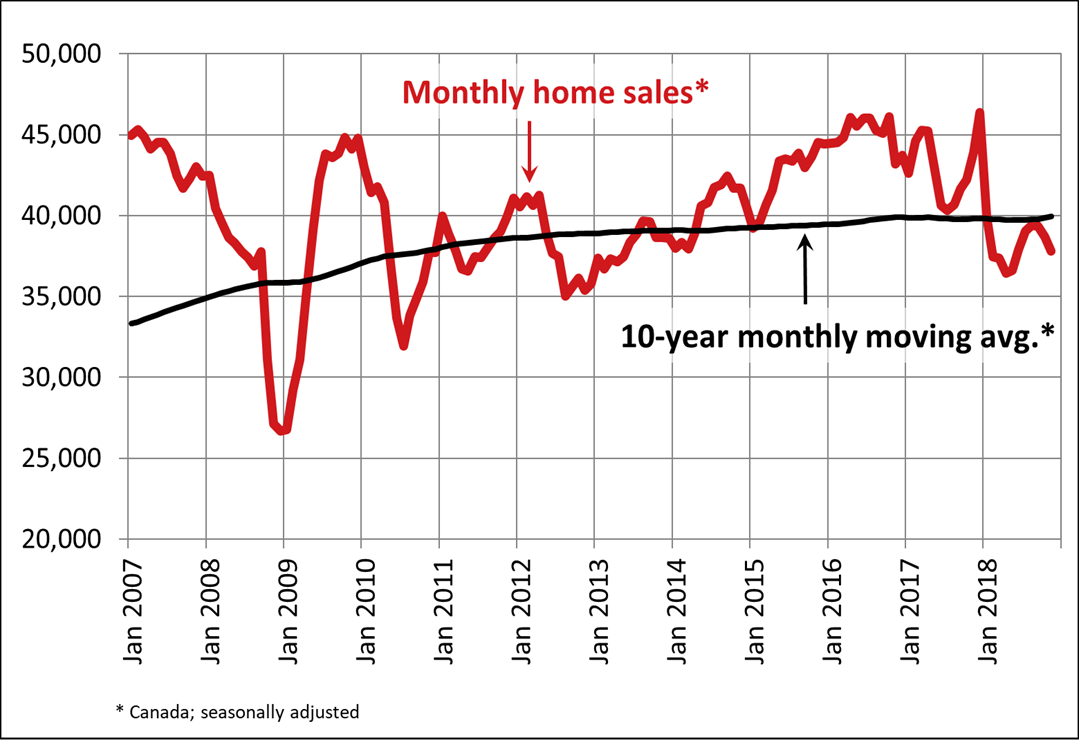
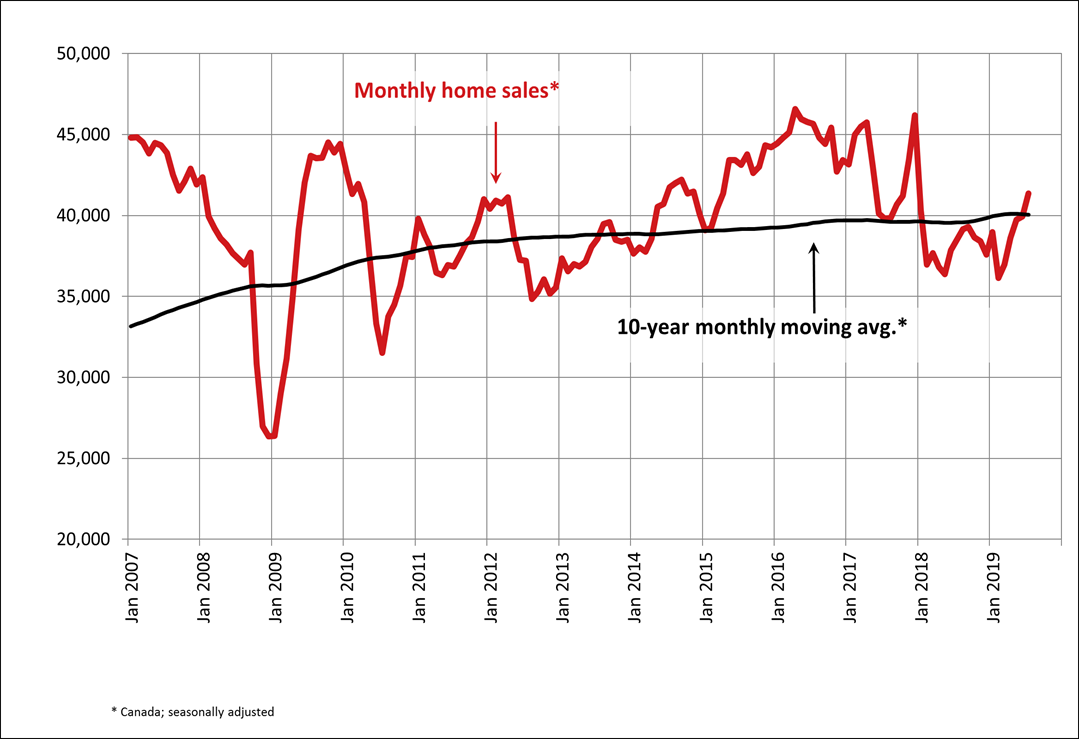
Home sales recorded via Canadian MLS® Systems rose for the fifth consecutive month in July, putting them about 15% above the six-year low reached in February 2019 but still more than 10% below the highs reached in 2016 and 2017. (Chart A)

Activity advanced in about 60% of all local markets. While the monthly increase was led by Greater Vancouver (GVA) and Greater Toronto (GTA), sales there remain well below levels recorded prior to the mortgage stress test that came into effect in 2018.

Actual (not seasonally adjusted) sales activity stood 12.6% above July 2018. Sales were up from year-ago levels in most of Canada’s largest markets, including the Lower Mainland of British Columbia, Calgary, Edmonton, the GTA and Hamilton-Burlington, Ottawa and Montreal.

“The extent to which recent declines in mortgage interest rates have helped lift sales activity varies by community and price segment,” said Jason Stephen, CREA’s President. “All real estate is local. Nobody knows that better than a professional REALTOR®, your best source for information and guidance when negotiating the sale or purchase of a home,” said Stephen.

“Sales are starting to rebound in places where they dropped when the mortgage stress test took effect at the beginning of 2018, but activity there remains well below levels recorded prior to its introduction,” said Gregory Klump, CREA’s Chief Economist “By the same token, sales continue to rise in housing markets where the mortgage stress test had little impact due to upbeat local economic conditions and a supply of affordably priced homes. Meanwhile, the mortgage stress test is doing no favours for homebuyers and sellers alike in places facing challenging local economic prospects and subdued consumer sentiment.”

The number of newly listed homes edged back by 0.4% in July. There was an almost even split between the number of local markets where new listings rose and those where they eased. The increase in new listings in Calgary, the GTA and Edmonton offset a decline in new listings in the Lower Mainland of British Columbia and Montreal.

The monthly sales increase together with a marginal monthly decline in new listings resulted in the national sales-to-new listings ratio tightening to 59.8% in July from 57.6% recorded in June. This marks its tightest reading and the biggest deviation above its long-term average (of 53.6%) in the past year.

Considering the degree and duration to which market balance readings are above or below their long-term averages is the best way of gauging whether local housing market conditions favour buyers or sellers. Market balance measures that are within one standard deviation of their long-term average are generally consistent with balanced market conditions.

Based on a comparison of the sales-to-new listings ratio with the long-term average, about three-quarters of all local markets were in balanced market territory in July 2019. Of the remainder, all but a few Prairie markets were above the long-term average.

The number of months of inventory is another important measure of the balance between sales and the supply of listings. It represents how long it would take to liquidate current inventories at the current rate of sales activity.

There were 4.7 months of inventory on a national basis at the end of July 2019 – the lowest level since December 2017. While remaining close to its long-term average of 5.3 months, this measure of market balance has increasingly been retreating below it.

While national measures of market balance are still generally in the ballpark of their long-term averages and indicate supply and demand are fairly well balanced, there are significant regional variations.

The number of months of inventory has swollen far beyond long-term averages in Prairie provinces and Newfoundland & Labrador, giving homebuyers ample choice in these regions. By contrast, the measure remains well below long-term averages in Ontario and Maritime provinces, resulting in increased competition among buyers for listings and fertile ground for price gains.

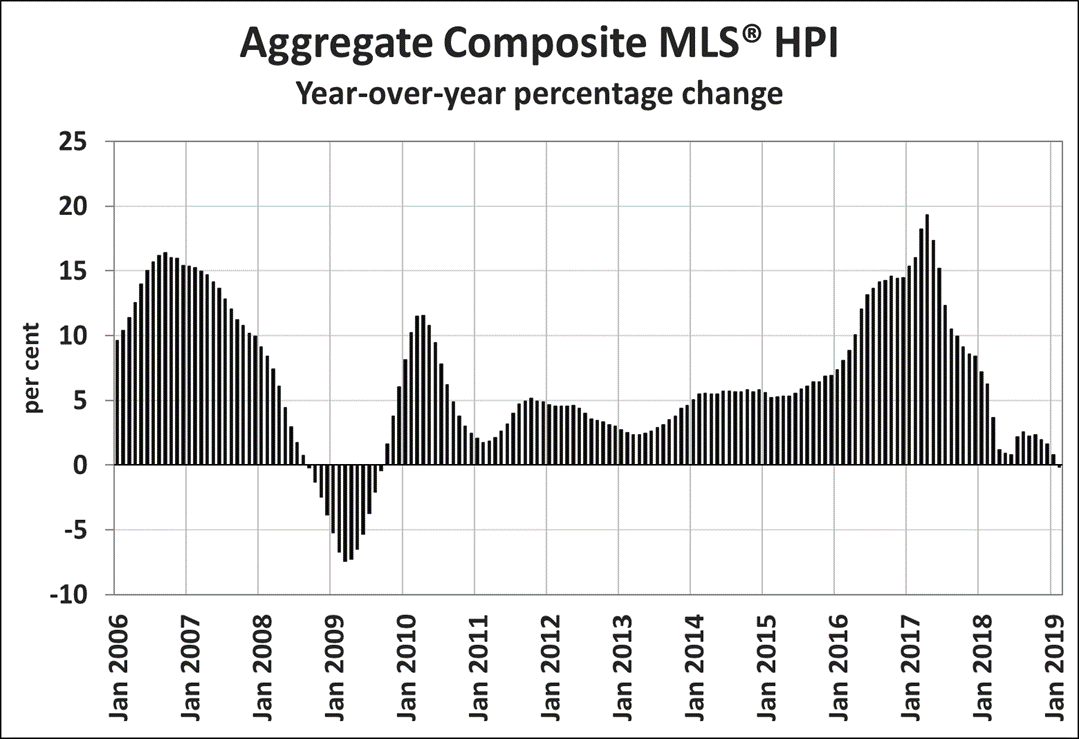
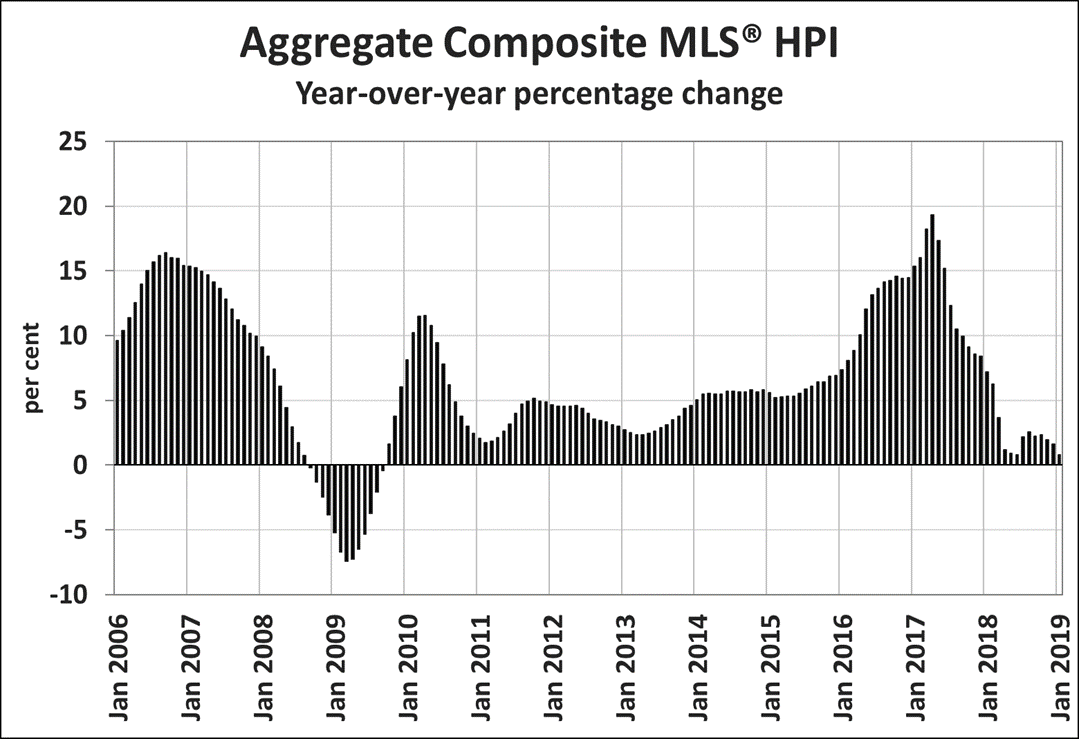
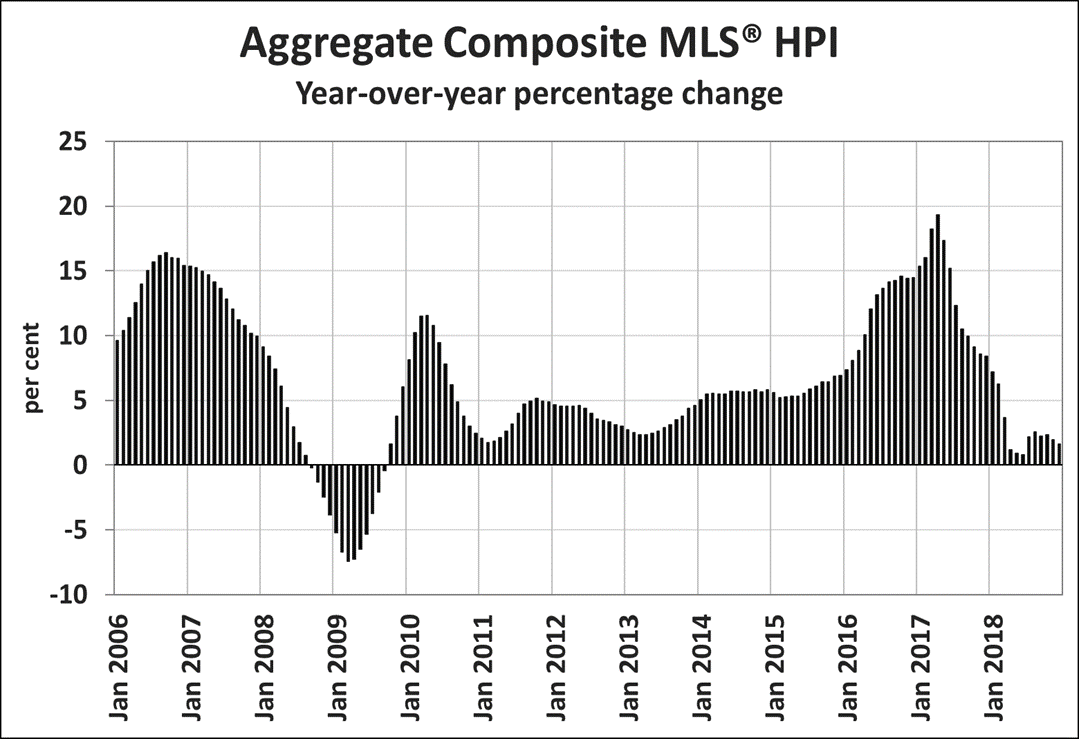
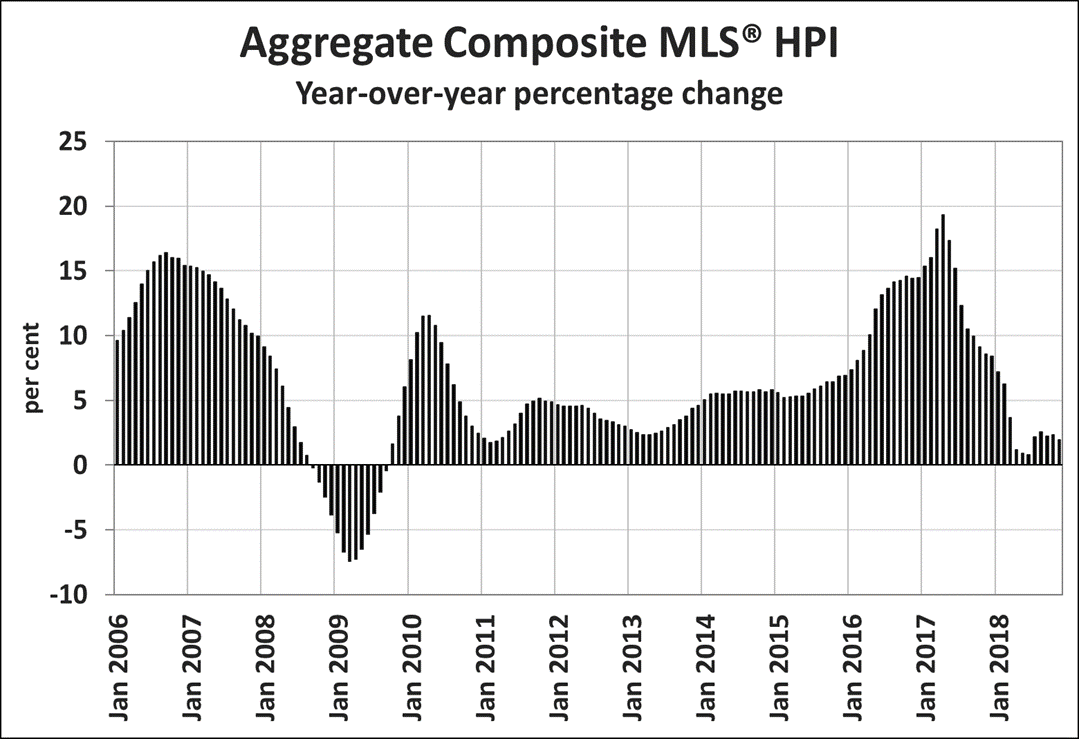
The Aggregate Composite MLS® Home Price Index (MLS® HPI) rose 0.6% m-o-m in July 2019, the largest increase in over 2 years.

Seasonally adjusted MLS® HPI readings in July were up from the previous month in 11 of the 18 markets tracked by the index. July’s trends were generally in line with June’s, with virtually all of the gains recorded in housing markets east of the Prairie region.

Prices were flat on a m-o-m basis across the Prairies, with the only material declines posted in the GVA (-0.6%) and Fraser Valley (-0.4%), where declines were smaller than those posted in June.

By contrast, monthly gains were posted in Barrie (+1.9%), Oakville (+1.8%), Greater Moncton (+1%), the GTA (+0.9%), Guelph (+0.8%), Ottawa (+0.8%), Greater Montreal (+0.7%), Hamilton (+0.3%) and the Niagara Region (+0.3%).

The actual (not seasonally adjusted) Aggregate Composite MLS® HPI edged up by 0.2% y-o-y in July 2019 – the first increase since January. (Chart B)

Two-storey single-family home prices edged up 0.3% y-o-y in July, while prices for one-storey single family homes and condo apartment units held steady. By contrast, townhouse/row prices retreated by 0.7% y-o-y.

A comparison of home prices to year-ago levels yields considerable variations across the country, with the main theme being declines in western Canada and price gains in central and eastern Canada.

Results remain mixed in British Columbia, with prices down on a y-o-y basis in Greater Vancouver (-9.4%), the Fraser Valley (-6.7%) and the Okanagan Valley (-0.9%). Meanwhile, prices were up 1.2% in Victoria and climbed 3.4% elsewhere on Vancouver Island.

Among Greater Golden Horseshoe housing markets tracked by the index, MLS® HPI benchmark home prices were up from year-ago levels in Guelph (+6.9%), the Niagara Region (+5.9%), Hamilton-Burlington (+5%), Oakville-Milton (+5%) and the GTA (+4.4%). By contrast, home prices in Barrie held below year-ago levels (-1.3%).

Across the Prairies, supply remains historically elevated relative to sales and home prices remain below year-ago levels. Benchmark prices were down by 3.5% in Calgary, 3.2% in Edmonton, 4.4% in Regina and 1.3% in Saskatoon. The home pricing environment will likely remain weak in these cities until demand and supply return to better balance.

Home prices rose 8.9% y-o-y in Ottawa (led by a 13.7% increase in townhouse/row unit prices), 7.3% in Greater Montreal (led by an 8.5% increase in apartment unit prices), and 2.4% in Greater Moncton (led by a 28.4% jump in apartment unit prices). (Table 1)

The MLS® HPI provides the best way to gauge price trends, because averages are strongly distorted by changes in the mix of sales activity from one month to the next.

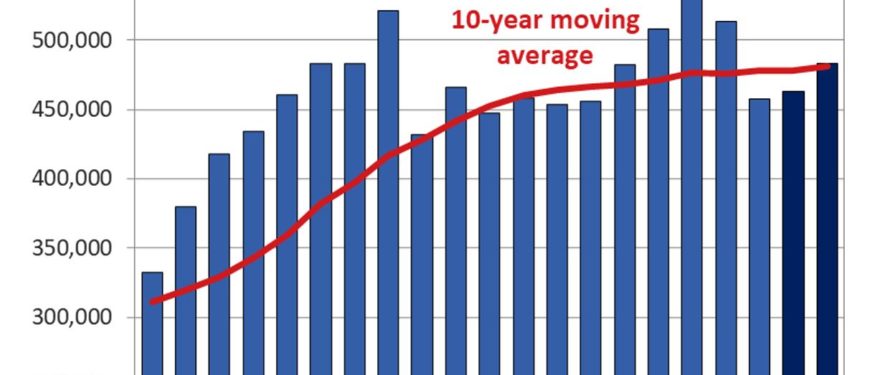
The actual (not seasonally adjusted) national average price for homes sold in July 2019 was just under $499,000, up 3.9% from the same month last year.

The national average price is heavily skewed by sales in the GVA and GTA, two of Canada’s most active and expensive housing markets. Excluding these two markets from calculations cuts more than $105,000 from the national average price, trimming it to less than $393,000.

– 30 –

PLEASE NOTE: The information contained in this news release combines both major market and national sales information from MLS® Systems from the previous month.

CREA cautions that average price information can be useful in establishing trends over time, but does not indicate actual prices in centres comprised of widely divergent neighbourhoods or account for price differential between geographic areas. Statistical information contained in this report includes all housing types.

MLS® Systems are co-operative marketing systems used only by Canada’s real estate Boards to ensure maximum exposure of properties listed for sale.

The Canadian Real Estate Association (CREA) is one of Canada’s largest single-industry trade associations, representing more than 130,000 REALTORS® working through 90 real estate boards and associations.

Further information can be found at http://crea.ca/statistics.

For more information, please contact:

Pierre Leduc, Media Relations
The Canadian Real Estate Association
Tel.: 613-237-7111 or 613-884-1460
E-mail: [email protected]

< Back to Newsroom

Canadian home sales hold steady in June

Ottawa, ON, July 15, 2019 – Statistics released today by the Canadian Real Estate Association (CREA) show national home sales were little changed in June 2019 from the previous month.

Highlights:

  • National home sales edged back 0.2% month-over-month (m-o-m) in June.
  • Actual (not seasonally adjusted) activity ticked up 0.3% year-over-year (y-o-y).
  • The number of newly listed homes rose 0.8% m-o-m.
  • The MLS® Home Price Index (HPI) climbed 0.3% m-o-m in June but was down 0.3% y-o-y.
  • The actual (not seasonally adjusted) national average sale price was up 1.7% y-o-y.

Home sales recorded via Canadian MLS® Systems were little changed in June 2019 following a string of monthly gains recorded in March, April and May. Although running close to its 10-year average and up nearly 10% from the six-year low reached in February 2019, activity remains well below levels recorded over much of 2015, 2016 and 2017. (Chart A)

The nearly unchanged national tally in June was the result of an even split between the number of local markets where sales were up and those where they were down. Larger monthly gains were generally focused in the province of Quebec and in Southern Ontario. Those gains were offset by declines in a diverse mix of markets across Canada, including Greater Vancouver (GVA), Calgary, Halifax-Dartmouth and the province of Newfoundland and Labrador.

Actual (not seasonally adjusted) sales activity edged up 0.3% compared to June 2018, with gains in Greater Toronto (GTA) and Montreal offsetting declines in B.C.

“Sales activity is strong in New Brunswick where I do business, but it’s a very different story in B.C., Alberta and Saskatchewan,” said Jason Stephen, CREA’s President. “All real estate is local. Nobody knows that better than a professional REALTOR®, who is your best source for information and guidance when negotiating the sale or purchase of a home,” said Stephen.

“There’s a growing divergence in Canadian housing market trends between eastern and western Canada,” said Gregory Klump, CREA’s Chief Economist. “While sales activity in Canada’s three westernmost provinces appears to have stopped deteriorating, it will be some time before supply and demand there becomes better balanced and the outlook for home prices improves.”

The number of newly listed homes edged up 0.8% in June. Stable sales and a slight increase in new listings caused the national sales-to-new listings ratio to ease marginally to 57.1% in June from 57.7% posted in May. This measure remains within close reach of its long-term average of 53.5%.

Considering the degree and duration to which market balance readings are above or below their long-term averages is the best way of gauging whether local housing market conditions favour buyers or sellers. Market balance measures that are within one standard deviation of their long-term average are generally consistent with balanced market conditions.

Based on a comparison of the sales-to-new listings ratio with the long-term average, over 80% of all local markets were in balanced market territory in June 2019, the largest share in over three years.

The number of months of inventory is another important measure of the balance between sales and the supply of listings. It represents how long it would take to liquidate current inventories at the current rate of sales activity.

There were 5 months of inventory on a national basis at the end of June 2019. While this is its lowest level since January 2018, this measure of market balance remains within close reach of its long-term average of 5.3 months.

While national measures of market balance are currently close to their long-term averages, which indicates a good balance between supply and demand, there are significant regional variations.

The number of months of inventory has swollen far beyond long-term averages in Prairie provinces and Newfoundland & Labrador, giving homebuyers ample choice in these regions. By contrast, the measure remains well below long-term averages in Ontario and the Maritime provinces, resulting in increased competition among buyers for listings and fertile ground for price gains.

Although the seasonally adjusted Aggregate Composite MLS® HPI rose 0.3% in June 2019 from the month before, it was still running 1.1% below the peak reached in December 2018. Looking past monthly variations, the overall trend has remained stable since March amid divergent regional trends. (Chart B)

Seasonally adjusted MLS® HPI readings in June were up from the previous month in 9 of the 18 markets tracked by the index, with virtually all of the gains recorded in housing markets east of the Prairie region.

Prices were flat on a m-o-m basis on Vancouver Island and in Calgary, Edmonton, Regina, Saskatoon and Moncton. Material declines were limited to the GVA (-1.3%), the Fraser Valley ( 0.8%) and the Okanagan Valley (-0.5%).

By contrast, monthly gains were posted in Barrie (+1.4%), Hamilton (+1.3%), Niagara (+1.2%), Guelph (+1.1%), Ottawa (+0.7%), Greater Montreal (+0.7%), the GTA (+0.6%) and Oakville (0.3%).

The actual (not seasonally adjusted) Aggregate Composite MLS® Home Price Index (MLS® HPI) edged down by -0.3% y-o-y in June 2019. For the second month in a row, all benchmark property categories tracked by the index posted y-o-y declines.

Two-storey single-family home prices were little changed from last June, edging back 0.1%. By comparison, one-storey single-family home prices posted the largest y-o-y decline (-0.8%) among benchmark property categories. Meanwhile, townhouse/row prices were down by 0.7% y-o-y and apartment unit prices edged back by 0.4%.

Y-o-y trends continue to vary widely across the country, with the main theme being a growing divergence in trends between eastern and western Canada.

Results remain mixed in British Columbia, with prices down on a y-o-y basis in Greater Vancouver (-9.6%), the Fraser Valley (-6.6%) and the Okanagan Valley (-0.8%). Meanwhile, prices edged up 0.5% in Victoria and climbed 4.2% elsewhere on Vancouver Island.

Among Greater Golden Horseshoe housing markets tracked by the index, MLS® HPI benchmark home prices were up from year-ago levels in Guelph (+6.8%), the Niagara Region (+6.7%), Hamilton-Burlington (+5.4%), the GTA (+3.6%) and Oakville-Milton (+3%). By contrast, home prices in Barrie held below year-ago levels (-2.4%).

Across the Prairies, supply remains historically elevated relative to sales and home prices remain below year-ago levels. Benchmark prices were down by 3.9% in Calgary, 3.2% in Edmonton, 4% in Regina and 1.1% in Saskatoon. The home pricing environment will likely remain weak in these cities until demand and supply return to better balance.

Home prices rose 8.3% y-o-y in Ottawa (led by a 13.2% increase in townhouse/row unit prices), 6.7% in Greater Montreal (led by an 8% increase in apartment unit prices), and 1.3% in Greater Moncton (led by an 18.4% increase in apartment unit prices). (Table 1)

The MLS® HPI provides the best way to gauge price trends, as averages are strongly distorted by changes in the mix of sales activity from one month to the next.

The actual (not seasonally adjusted) national average price for homes sold in June 2019 was just under $505,500, up 1.7% from the same month in 2018.

The national average price is heavily skewed by sales in the GVA and GTA, two of Canada’s most active and expensive housing markets. Excluding these two markets from calculations cuts almost $106,000 from the national average price, trimming it to less than $400,000.

– 30 –

PLEASE NOTE: The information contained in this news release combines both major market and national sales information from MLS® Systems from the previous month. 

CREA cautions that average price information can be useful in establishing trends over time, but does not indicate actual prices in centres comprised of widely divergent neighbourhoods or account for price differential between geographic areas. Statistical information contained in this report includes all housing types. 

MLS® Systems are co-operative marketing systems used only by Canada’s real estate Boards to ensure maximum exposure of properties listed for sale. 

The Canadian Real Estate Association (CREA) is one of Canada’s largest single-industry trade associations, representing more than 130,000 REALTORS® working through some 90 real estate Boards and Associations.

Further information can be found at http://crea.ca/statistics.

For more information, please contact:

Pierre Leduc, Media Relations
The Canadian Real Estate Association
Tel.: 613-237-7111 or 613-884-1460
E-mail: [email protected]

< Back to Newsroom

Canadian home sales rise again in May 2019

Ottawa, ON, June 14, 2019 – Statistics released today by the Canadian Real Estate Association (CREA) show national home sales climbed further in May 2019.

Highlights:

  • National home sales rose 1.9% month-over-month (m-o-m) in May.
  • Actual (not seasonally adjusted) activity was up 6.7% year-over-year (y-o-y).
  • The number of newly listed homes edged back by 1.2% m-o-m.
  • The MLS® Home Price Index (HPI) fell 0.2% m-o-m in May, the fifth straight decline.
  • The actual (not seasonally adjusted) MLS® HPI stood 0.6% below May 2018.
  • The actual (not seasonally adjusted) national average sale price was up 1.8% y-o-y.

Home sales recorded via Canadian MLS® Systems rose by 1.9% in May 2019. Together with monthly gains in March and April, activity in May reached the highest level since January 2018. While sales stood 8.9% above the six-year low reached in February 2019, this latest increase has only just returned levels to their historical average. (Chart A)

While May sales were only up in half of all local markets, that list included almost all large markets, led by gains in both the Greater Vancouver (GVA) and Greater Toronto (GTA) areas.

Actual (not seasonally adjusted) sales activity was up 6.7% compared to May 2018, marking the largest y-o-y gain recorded since the summer of 2016. The increase returned sales in line with the 10-year average for the month of May. While about two-thirds of local markets posted y-o-y gains for the month, the national increase was dominated by improving sales trends in the GTA, which accounted for close to half of the overall increase.

“Home price trends and market balance continues to differ significantly among Canadian housing markets,” said Jason Stephen, CREA’s President. “All real estate is local. No matter where you are, a professional REALTOR® is your best source for information and guidance in negotiations to purchase or sell a home during these changing times,” said Stephen.

“The mortgage stress-test continues to present challenges for home buyers in housing markets where they have plenty of homes to choose from but are forced by the test to save up a bigger down payment,” said Gregory Klump, CREA’s Chief Economist. “Hopefully the stress-test can be fine tuned to enable home buyers to qualify for mortgage financing sooner without causing prices to shoot up.”

The number of newly listed homes edged back by 1.2% in May. With sales up and new listings down, the national sales-to-new listings ratio tightened to 57.4% in May compared to 55.7% in April. That said, the measure is still within close reach of its long-term average of 53.5%.

Considering the degree and duration to which market balance readings are above or below their long-term averages is the best way of gauging whether local housing market conditions favour buyers or sellers. Market balance measures that are within one standard deviation of their long-term average are generally consistent with balanced market conditions.

Based on a comparison of the sales-to-new listings ratio with the long-term average, almost three-quarters of all local markets were in balanced market territory in May 2019.

The number of months of inventory is another important measure of the balance between sales and the supply of listings. It represents how long it would take to liquidate current inventories at the current rate of sales activity.

There were 5.1 months of inventory on a national basis at the end of May 2019, down from 5.3 in April and 5.6 months back in February. Like the sales-to-new listings ratio, the number of months of inventory is within close reach its long-term average of 5.3 months.

Housing market balance varies significantly by region. The number of months of inventory has swollen far beyond long-term averages in Prairie provinces and Newfoundland & Labrador, giving homebuyers in those parts of the country ample choice. By contrast, the measure remains well below long-term averages for Ontario and Maritime provinces, resulting in increased competition among buyers for listings and fertile ground for price gains.

MLS® HPI data are now available on a seasonally adjusted basis in addition to the actual (not seasonally adjusted) figures. On a seasonally adjusted basis, the Aggregate Composite MLS® HPI edged down 0.2% in May 2019 compared to April and stood 1.4% below the peak reached in December 2018.

Seasonally adjusted MLS® HPI readings in May were up from the previous month in 12 of the 18 markets tracked by the index; however, home price declines in the Lower Mainland of British Columbia contributed to the monthly decline in the overall index. Markets where prices rose in May from the month before include Victoria (0.5%), Edmonton (0.2%), Saskatoon (0.4%), Ottawa (0.7%), Niagara (0.2%), Oakville (0.8%), Guelph (0.5%), Barrie (3.6%), Montreal (0.5%) and Greater Moncton (0.5%), with gains of 0.1% in the GTA and Regina. By contrast, readings were down from the month before in the GVA (-1.0%), Fraser Valley (-1.1%), the Okanagan Valley (-1.3%), Calgary (-0.1%) and Hamilton (-0.7%), while holding steady on Vancouver Island outside Victoria.

The actual (not seasonally adjusted) Aggregate Composite MLS® Home Price Index (MLS® HPI) edged down by -0.6% y-o-y in May 2019. While small, it was nonetheless the largest decline in almost a decade. (Chart B)

All benchmark property categories tracked by the index posted y-o-y declines in May 2019. Townhouse/row and apartment unit prices were little changed from last May, edging back by just 0.2%. By comparison, two-storey single-family home prices were down 0.5% y-o-y and one-storey single-family home prices fell 1.7% y-o-y.

Trends continue to vary widely among the 18 housing markets tracked by the MLS® HPI. Results remain

mixed in British Columbia, with prices down on a y-o-y basis in the GVA (-8.9%), the Fraser Valley (-5.9%) and the Okanagan Valley (-0.7%). Meanwhile, prices edged up 1% in Victoria and climbed 4.7% elsewhere on Vancouver Island.

Among Greater Golden Horseshoe housing markets tracked by the index, MLS® HPI benchmark home prices were up from year-ago levels in Guelph (+5.7%), the Niagara Region (+5.4%), Hamilton-Burlington (+3.4%), Oakville-Milton (+3.4%) and the GTA (+3.1%). By contrast, home prices in Barrie and District held below year-ago levels (-6.1%).

Across the Prairies, supply remains historically elevated relative to sales and home prices remain below year-ago levels. Benchmark prices were down by 4.3% in Calgary, 3.6% in Edmonton, 3.9% in Regina and 1.3% in Saskatoon. The home pricing environment will likely remain weak in these cities until demand and supply return to better balance.

Home prices rose 8% y-o-y in Ottawa (led by a 12.2% increase in townhouse/row unit prices), 6.3% in Greater Montreal (led by a 7.6% increase in apartment unit prices), and 2% in Greater Moncton (led by a 15.9% increase in apartment unit prices). (Table 1)

The MLS® HPI provides the best way to gauge price trends, as averages are strongly distorted by changes in the mix of sales activity from one month to the next.

The actual (not seasonally adjusted) national average price for homes sold in May 2019 was close to $508,000, up 1.8% from the same month in 2018.

The national average price is heavily skewed by sales in the GVA and GTA, two of Canada’s most active and expensive housing markets. Excluding these two markets from calculations cuts almost $111,000 from the national average price, trimming it to just under $397,000.

– 30 –

PLEASE NOTE: The information contained in this news release combines both major market and national sales information from MLS® Systems from the previous month. 

CREA cautions that average price information can be useful in establishing trends over time, but does not indicate actual prices in centres comprised of widely divergent neighbourhoods or account for price differential between geographic areas. Statistical information contained in this report includes all housing types. 

MLS® Systems are co-operative marketing systems used only by Canada’s real estate Boards to ensure maximum exposure of properties listed for sale. 

The Canadian Real Estate Association (CREA) is one of Canada’s largest single-industry trade associations, representing more than 130,000 REALTORS® working through some 90 real estate Boards and Associations.

Further information can be found at http://crea.ca/statistics.

For more information, please contact:

Pierre Leduc, Media Relations
The Canadian Real Estate Association
Tel.: 613-237-7111 or 613-884-1460
E-mail: [email protected]

< Back to Newsroom

Quarterly Forecasts

CREA Updates Resale Housing Market Forecast

Ottawa, ON, June 14, 2019 – The Canadian Real Estate Association (CREA) has updated its forecast for home sales activity via the Multiple Listing Service® (MLS®) Systems of Canadian real estate boards and associations in 2019 and 2020.

Many of the economic fundamentals that support housing activity remain strong outside of the Prairies as well as Newfoundland and Labrador. Following the release of CREA’s previous forecast in March, population and employment growth has remained strong and the unemployment rate has fallen further. Additionally, the Bank of Canada is widely expected to not raise interest rates over the rest of the year.

Budget 2019 also raised the maximum individual withdrawal limit under the Home Buyers’ Plan (HBP) from $25,000 to $35,000 and introduced the First Time Homebuyer Incentive, a shared equity program whereby the federal government finances a portion of a home purchase in exchange for an equity share in the home’s value. The increased HBP withdrawal limit took effect in late March, while the First Time Homebuyer Incentive is slated to launch in September.

These factors are expected to support to the beginnings of a recovery in home sales over the second half of 2019 after starting this year on a weak footing. Nonetheless, the overall level of sales is expected to remain well below where it was in recent years, as successive policy changes  – most notably the implementation of the B-20 stress test – continue to limit access to mortgage financing and dampen housing market sentiment. This is particularly the case in pricier areas where younger buyers have had little choice but to borrow more to get into the market.

National home sales are now projected to edge up 1.2% to 463,000 units in 2019. CREA’s previous forecast estimated a decline of 1.6% this year. This would still leave annual sales below the 10-year average and a far cry from the annual record set in 2016, when almost 540,000 homes traded hands. On a per capita basis, the forecast for 2019 would remain effectively tied with 2018 for the weakest year since 2001.

British Columbia is the only province expected to weigh materially on national figures in 2019, with a decline of 13.3% compared to 2018, marking a small upward revision from the previously forecast decline of 14.9%. Other revisions from the previous forecast for sales in 2019 were also upward, with Alberta moving from a 5.6% decline to a 0.9% decline, and Ontario’s gain upgraded from 0.9% previously to 3.9%.

Quebec and New Brunswick are still forecast to see the biggest sales gains in percentage terms in 2019 (+7.7% and +10.6%, respectively), with both provinces on track to set new annual records. Sales in Saskatchewan and Newfoundland and Labrador are forecast to improve by almost 5%, albeit from the lowest levels in more than a decade recorded last year. Meanwhile, activity in Manitoba and Nova Scotia is forecast to rise between 3.5% and 4.5% to near-record annual levels.

The national average price is still projected to stabilize (-0.6%) at around $485,000 in 2019 following the 4.1% drop recorded in 2018, which was the largest in almost 25 years. This reflects a stark and growing split between Eastern and Western regions. In line with the balance between supply and demand across the country, average prices are forecast to fall in 2019 in British Columbia, Alberta, Saskatchewan, and rise in Ontario, Quebec and the Maritimes. The average price is also expected to fall for the fifth consecutive year in Newfoundland and Labrador.

Sales are forecast to continue to improve in 2020. Absent the weak start experienced in 2019, national home sales are forecast to rise 4.4% to 483,200 units as interest rates remain near current levels and potential home buyers continue to adjust and adapt to the assortment of recent policy changes. Almost all provinces are forecast to see more sales in 2020 compared to 2019, with gains ranging from 1% to 6%.

That said, the big picture is that sales are expected to remain historically weak in British Columbia, Alberta, Saskatchewan and Newfoundland and Labrador, historically strong in Quebec, New Brunswick, Manitoba and Nova Scotia, and come in close to the 10-year average in Ontario.

The national average price is forecast to edge up by 0.9% to around $490,000 in 2020. Average price trends across Canada in 2020 are generally expected to be more moderate versions of those in 2019, with small declines in British Columbia, Alberta, Saskatchewan and Newfoundland and Labrador, and modest gains in all provinces from Manitoba through the Maritimes.

– 30 –

About The Canadian Real Estate Association
The Canadian Real Estate Association (CREA) is one of Canada’s largest single-industry trade associations. CREA works on behalf of more than 130,000 REALTORS® who contribute to the economic and social well-being of communities across Canada. Together they advocate for property owners, buyers and sellers.

For more information, please contact:
Pierre Leduc, Media Relations
The Canadian Real Estate Association
Tel.: 613-237-7111 or 613-884-1460
E-mail: [email protected]­

< Back to Newsroom

Canadian home sales rise in April 2019

Ottawa, ON, May 15, 2019 – Statistics released today by the Canadian Real Estate Association (CREA) show national home sales climbed in April 2019.

Highlights:

  • National home sales improved by 3.6% month-over-month (m-o-m) in April.
  • Actual (not seasonally adjusted) activity was up 4.2% year-over-year (y-o-y).
  • The number of newly listed homes climbed 2.7% m-o-m.
  • The MLS® Home Price Index (HPI) eased by 0.3% y-o-y in April.
  • The national average sale price edged up 0.3% y-o-y.

Home sales recorded via Canadian MLS® Systems rose by 3.6% m-o-m in April 2019. After having dropped in February to the lowest level since 2012, the rebound in sales over the past two months still leaves activity slightly below readings posted over most of the second half of 2018. (Chart A)

April sales were up in about 60% of all local markets, with the Greater Toronto Area (GTA) accounting for over half of the national gain.

Actual (not seasonally adjusted) sales activity was up 4.2% y-o-y in April (albeit from a seven-year low for the month in 2018), the first y-o-y gain since December 2017 and the largest in more than two years. The increase reflects gains in the GTA and Montreal that outweighed declines in the B.C. Lower Mainland.

“Housing market trends are improving in some places and not so much in others,” said Jason Stephen, CREA’s President. “All real estate is local. No matter where you are, a professional REALTOR® is your best source for information and guidance in negotiations to purchase or sell a home during these changing times,” said Stephen.

“Sales activity is stabilizing among Canada’s five most active urban housing markets,” said Gregory Klump, CREA’s Chief Economist. “That list no longer includes Greater Vancouver, which fell out of the top-five list for the first time since the recession and is well into buyers’ market territory. Sales there are still trending lower as buyers adjust to a cocktail of housing affordability challenges, reduced access to financing due to the mortgage stress-test and housing policy changes implemented by British Columbia’s provincial government,” said Klump.

The number of newly listed homes rose 2.7% in April, building on March’s 3.4% increase. New supply rose in about 60% of all local markets, led by the GTA and Ottawa.

With sales up by more than new listings in April, the national sales-to-new listings ratio tightened marginally to 54.8% from 54.3% in March. This measure of market balance has remained close to its long-term average of 53.5% since early 2018.

Considering the degree and duration to which market balance readings are above or below their long-term averages is the best way of gauging whether local housing market conditions favour buyers or sellers. Market balance measures that are within one standard deviation of their long-term average are generally consistent with balanced market conditions.

Based on a comparison of the sales-to-new listings ratio with the long-term average, about three-quarters of all local markets were in balanced market territory in April 2019.

The number of months of inventory is another important measure of the balance between sales and the supply of listings. It represents how long it would take to liquidate current inventories at the current rate of sales activity.

There were 5.3 months of inventory on a national basis at the end of April 2019, down from 5.6 and 5.5 months in February and March respectively and in line with the long-term average for this measure.

Housing market balance varies significantly by region. The number of months of inventory has swollen far beyond long-term averages in Prairie provinces and Newfoundland & Labrador, giving homebuyers there ample choice. By contrast, the measure remains well below long-term averages in Ontario and Maritime provinces, resulting in increased competition among buyers for listings and fertile ground for price gains.

The Aggregate Composite MLS® Home Price Index (MLS® HPI) appears to be stabilizing, having edged lower by 0.3% y-o-y in April 2019. (Chart B)

Among benchmark property categories tracked by the index, apartment units were again the only one to post a y-o-y price gain in April 2019 (0.5%), while two-storey single-family home and townhouse/row unit prices were little changed from April 2018 (-0.3% and -0.2%, respectively). By comparison, one-storey single-family home prices were down by -1.4% y-o-y.

Trends continue to vary widely among the 18 housing markets tracked by the MLS® HPI. Results remain mixed in British Columbia, with prices down on a y-o-y basis in Greater Vancouver (GVA; -8.5%) and the Fraser Valley (-4.6%), up slightly in the Okanagan Valley (1%) and Victoria (0.7%), while climbing 6.2% elsewhere on Vancouver Island.

Among Greater Golden Horseshoe housing markets tracked by the index, MLS® HPI benchmark home prices were up from year-ago levels in the Niagara Region (6.2%), Guelph (5.1%), Hamilton-Burlington (4.6%) the GTA (3.2%) and Oakville-Milton (2.5%). By contrast, home prices in Barrie and District held below year-ago levels (-5.3%).

Across the Prairies, supply remains historically elevated relative to sales and home prices remain below year-ago levels. Benchmark prices were down by 4.6% in Calgary, 4% in Edmonton, 4.3% in Regina and 1.7% in Saskatoon. The home pricing environment will likely remain weak in these cities until demand and supply return to better balance.

Home prices rose 7.8% y-o-y in Ottawa (led by an 11% increase in townhouse/row unit prices), 6.3% in Greater Montreal (led by a 7.8% increase in apartment unit prices), and 1.8% in Greater Moncton (led by an 11.5% increase in apartment unit prices). (Table 1)

The MLS® HPI provides the best way to gauge price trends, as averages are strongly distorted by changes in the mix of sales activity from one month to the next.

The actual (not seasonally adjusted) national average price for homes sold in April 2019 was close to $495,000, up 0.3% from the same month in 2018.

The national average price is heavily skewed by sales in the GVA and GTA, two of Canada’s most expensive housing markets. Excluding these two

markets from calculations cuts almost $104,000 from the national average price, trimming it to just over $391,000.

– 30 –

PLEASE NOTE: The information contained in this news release combines both major market and national sales information from MLS® Systems from the previous month.

CREA cautions that average price information can be useful in establishing trends over time, but does not indicate actual prices in centres comprised of widely divergent neighbourhoods or account for price differential between geographic areas. Statistical information contained in this report includes all housing types.

MLS® Systems are co-operative marketing systems used only by Canada’s real estate Boards to ensure maximum exposure of properties listed for sale.

The Canadian Real Estate Association (CREA) is one of Canada’s largest single-industry trade associations, representing more than 130,000 REALTORS® working through 90 real estate boards and associations.

Further information can be found at http://crea.ca/statistics. 

For more information, please contact:
Pierre Leduc, Media Relations
The Canadian Real Estate Association
Tel.: 613-237-7111 or 613-884-1460
E-mail: [email protected]

< Back to Newsroom

Canadian home sales edge higher in March 2019

Ottawa, ON, April 15, 2019 – Statistics released today by the Canadian Real Estate Association (CREA) show national home sales edged higher in March 2019 after having declined sharply the previous month.

Highlights:

  • National home sales edged up 0.9% month-over-month (m-o-m) in March.
  • Actual (not seasonally adjusted) activity was down 4.6% year-over-year (y-o-y).
  • The number of newly listed homes rose 2.1% m-o-m.
  • The MLS® Home Price Index (HPI) eased by 0.5% y-o-y in March.
  • The national average sale price fell 1.8% y-o-y.

Home sales via Canadian MLS® Systems edged up 0.9% in March 2019 following a sharp drop in February, leaving activity near some of the lowest levels recorded in the last six years. (Chart A)

There was an even split between the number of markets where sales rose from the previous month and those where they waned. Among Canada’s larger cities, activity improved in Victoria, the Greater Toronto Area (GTA), Oakville-Milton and Ottawa, whereas it declined in Greater Vancouver, Edmonton, Regina, Saskatoon, London and St. Thomas, Sudbury and Quebec City.

Actual (not seasonally adjusted) sales activity fell 4.6% y-o-y to the weakest level for the month since 2013. It was also almost 12% below the 10-year average for March. That said, in British Columbia, Alberta and Saskatchewan, sales were more than 20% below their 10-year average for the month. By contrast, activity is running well above-average in Quebec and New Brunswick.

“It will be some time before policy measures announced in the recent Federal Budget designed to help first-time homebuyers take effect,” said Jason Stephen, CREA’s President. “In the meantime, many prospective homebuyers remain sidelined by the mortgage stress-test to varying degrees depending on where they are looking to buy. All real estate is local, and REALTORS® remain your best source for information about sales and listings where you live or might like to in the future,” added Stephen.

“March results suggest local market trends are largely in a holding pattern,” said Gregory Klump, CREA’s Chief Economist. “While the mortgage stress test has made access to home financing more challenging, the good news is that continuing job growth remains supportive for housing demand and should eventually translate into stronger home sales activity pending a reduction in household indebtedness,” he added.

The number of newly listed homes rose 2.1% in March. New supply rose in about two-thirds of all local markets, led by Winnipeg, Regina, Victoria and elsewhere on Vancouver Island. By contrast, new listings declined in the GTA, Ottawa and Halifax-Dartmouth.

With new listings having improved more than sales, the national sales-to-new listings ratio eased to 54.2% from 54.9% in February. This measure of market balance has largely remained close to its long-term average of 53.5% since early 2018.

Considering the degree and duration to which market balance readings are above or below their long-term averages is the best way of gauging whether local housing market conditions favour buyers or sellers. Market balance measures that are within one standard deviation of their long-term average are generally consistent with balanced market conditions.

Based on a comparison of the sales-to-new listings ratio with the long-term average, two-thirds of all local markets were in balanced market territory in March 2019.

The number of months of inventory is another important measure of the balance between sales and the supply of listings. It represents how long it would take to liquidate current inventories at the current rate of sales activity.

There were 5.6 months of inventory on a national basis at the end of March 2019, in line with the February reading and one of the highest levels for the measure in the last three-and-a-half-years. Still, it is only slightly above its long-term average of 5.3 months.

Housing market balance varies significantly by region. The number of months of inventory has swollen far above its long-term average in Prairie provinces and Newfoundland & Labrador; as a result, homebuyers there have an ample choice of listings available for purchase. By contrast, the measure remains well below its long-term average in Ontario and the Maritime provinces.

The Aggregate Composite MLS® Home Price Index (MLS® HPI) declined by 0.5% y-o-y in March 2019. It last posted a y-o-y decline of similar magnitude in September 2009. (Chart B)

Among benchmark property categories tracked by the index, apartment units were the only one to post a y-o-y price gain in March 2019 (+1.1%), while townhouse/row unit prices were little changed from March 2018 (-0.2%). By comparison, one and two-storey single-family home prices were down by 1.8% and 0.8% y-o-y respectively.

As of this release, the MLS® HPI now includes home sales via Okanagan-Mainline Real Estate Board’s MLS® System, which covers communities in the Okanagan Valley from Revelstoke to the Peachland region.

Trends continue to vary widely among the 18 housing markets tracked by the MLS® HPI. Results remain mixed in British Columbia, with prices down on a y-o-y basis in Greater Vancouver (-7.7%) and the Fraser Valley (-3.9%). Prices also dipped slightly below year-ago levels in the Okanagan Valley (-0.8%). By contrast, prices rose by 1% in Victoria and by 6.4% elsewhere on Vancouver Island.

Among Greater Golden Horseshoe housing markets tracked by the index, MLS® HPI benchmark home prices were up from year-ago levels in Guelph (+6.6%), the Niagara Region (+6.0%), Hamilton-Burlington (+3.7%) the GTA (+2.6%) and Oakville-Milton (+2.3%). By contrast, home prices in Barrie and District held below year-ago levels (-6.1%).

Across the Prairies, supply remains historically elevated relative to sales and home prices remain below year-ago levels. Benchmark prices were down by 4.9% in Calgary, 4.4% in Edmonton, 4.6% in Regina and 2.7% in Saskatoon. The home pricing environment will likely remain weak in these cities until demand and supply become more balanced.

Home prices rose 7.6% y-o-y in Ottawa (led by a 10.4% increase in townhouse/row unit prices), 6.3% in Greater Montreal (led by an 8.1% increase in apartment unit prices) and 2.1% in Greater Moncton (led by a 12.9% increase in apartment unit prices). (Table 1)

The MLS® HPI provides the best way to gauge price trends, as averages are strongly distorted by changes in the mix of sales activity from one month to the next.

The actual (not seasonally adjusted) national average price for homes sold in March 2019 was $481,745, down 1.8% from the same month in 2018.

The national average price is heavily skewed by sales in Greater Vancouver and the GTA, two of Canada’s most active and expensive markets. Excluding these two markets from calculations cuts close to $100,000 from the national average price, trimming it to just under $383,000.

– 30 –

PLEASE NOTE: The information contained in this news release combines both major market and national sales information from MLS® Systems from the previous month. 

CREA cautions that average price information can be useful in establishing trends over time, but does not indicate actual prices in centres comprised of widely divergent neighbourhoods or account for price differential between geographic areas. Statistical information contained in this report includes all housing types. 

MLS® Systems are co-operative marketing systems used only by Canada’s real estate Boards to ensure maximum exposure of properties listed for sale. 

The Canadian Real Estate Association (CREA) is one of Canada’s largest single-industry trade associations, representing more than 125,000 REALTORS® working through some 90 real estate Boards and Associations.

Further information can be found at http://crea.ca/statistics.

For more information, please contact:

Pierre Leduc, Media Relations
The Canadian Real Estate Association
Tel.: 613-237-7111 or 613-884-1460
E-mail: [email protected]

< Back to Newsroom

Canadian home sales drop sharply in February 2019

Ottawa, ON, March 15, 2019 – Statistics released today by the Canadian Real Estate Association (CREA) show national home sales dropped sharply from January to February 2019.

Highlights:

  • National home sales plummeted 9.1% month-over-month (m-o-m) in February.
  • Actual (not seasonally adjusted) activity was down 4.4% year-over-year (y-o-y).
  • The number of newly listed homes fell 3.2% m-o-m.
  • The MLS® Home Price Index (HPI) was virtually unchanged (-0.1% y-o-y).
  • The national average sale price fell by 5.2% y-o-y.

Home sales via Canadian MLS® Systems plunged 9.1% m-o-m in February 2019 to the lowest level since November 2012. The month-over-month decline was the largest recorded since the B-20 stress test came into effect in January of last year. (Chart A)

The number of homes trading hands was down from the previous month in three-quarters of all local markets, including all major cities.

Actual (not seasonally adjusted) sales activity was down 4.4% to reach the lowest level for month of February since 2009. It was also almost 12% below the 10-year February average. In British Columbia, Alberta as well as Newfoundland and Labrador, sales were more than 20% below their 10-year average for the month.

“For aspiring homebuyers being kept on the sidelines by the mortgage stress-test, it’s a bitter pill to swallow when policy makers say the policy is working as intended,” said Barb Sukkau. “Fewer qualified buyers means sellers are affected too. The impact of tighter mortgage regulations differs by local housing market and a professional REALTOR® remains your best source for information and guidance in negotiating the purchase or sale of a home during these changing times,” added Sukkau.

“February home sales declined across a broad swath of large and smaller Canadian cities,” said Gregory Klump, CREA’s Chief Economist. “The housing sector is on track to further reduce waning Canadian economic growth. Only time will tell whether successive changes to mortgage regulations went too far, since the impact of policy decisions becomes apparent only well after the fact. Hopefully policy makers are thinking about how to fine tune regulations to better keep housing affordability within reach while keeping lending risks in check.”

The number of newly listed homes declined by 3.2% in February, led by GTA regional municipalities that surround the City of Toronto, in addition to Hamilton-Burlington, Calgary, Edmonton and Winnipeg.

With sales down by more than new listings in February, the national sales-to-new listings ratio eased to 54.1% compared to 57.6% in January. Looking beyond its monthly volatility, this measure of market balance has remained close to the long-term average of 53.5% since early 2018.

Considering the degree and duration to which market balance readings are above or below their long-term averages is the best way of gauging whether local housing market conditions favour buyers or sellers. Market balance measures that are within one standard deviation of their long-term average are generally consistent with balanced market conditions.

Based on a comparison of the sales-to-new listings ratio with the long-term average, about 70% of all local markets were in balanced market territory in February 2019.

The number of months of inventory is another important measure of the balance between sales and the supply of listings. It represents how long it would take to liquidate current inventories at the current rate of sales activity.

There were 5.7 months of inventory on a national basis at the end of February 2019, a three-and-a-half-year high and a little above its long-term average of 5.3 months. That said, there are significant regional differences. The number of months of inventory has swollen far above its long-term average in Prairie provinces and Newfoundland & Labrador; as a result, homebuyers there have an ample choice of listings available for purchase. By contrast, the measure remains well below its long-term average in Ontario and the Maritimes.

The Aggregate Composite MLS® Home Price Index (MLS® HPI) was little changed (-0.1%) y-o-y in February 2019. That said, it still marked the first decline in almost a decade (Chart B).

Apartment units recorded a y-o-y price increase of 2.4% in February, while townhouse/row unit prices were up 1%. By comparison, one and two-storey single-family home prices were down 1.7% and 1% y-o-y in February.

Trends continue to vary widely among the 17 housing markets tracked by the MLS® HPI. Results remain mixed in British Columbia, with prices down on a y-o-y basis in Greater Vancouver (-6.1%) and the Fraser Valley (-2.8%). By contrast, prices posted a y-o-y increase of 3% in Victoria and were up 7.7% elsewhere on Vancouver Island.

Among Greater Golden Horseshoe housing markets tracked by the index, MLS® HPI benchmark home prices were up from year-ago levels in Guelph (+6.8%), the Niagara Region (+6.5%), Hamilton-Burlington (+5%) and the GTA (+2.3%). By contrast, home prices were little changed (+0.2%) on a y-o-y basis in Oakville-Milton, while in Barrie and District prices remain below year-ago levels (-4.3%).

Across the Prairies, supply is historically elevated relative to sales and home prices are down from year-ago levels. Benchmark prices were down by 4.4% in Calgary, 4.5% in Edmonton, 5.1% in Regina and 3% in Saskatoon. The home pricing environment will likely remain weak in these cities until demand and supply come back into better balance.

Home prices rose 7.4% y-o-y in Ottawa (led by a 10.8% increase in townhouse/row unit prices), 6.2% in Greater Montreal (led by a 7.8% increase in apartment unit prices) and 1.6% in Greater Moncton (led by a 7.9% increase in townhouse/row unit prices). (Table 1)

The MLS® HPI provides the best way to gauge price trends, as averages are strongly distorted by changes in the mix of sales activity from one month to the next.

The actual (not seasonally adjusted) national average price for homes sold in February 2019 was $468,350, down 5.2% from the same month in 2018.

The national average price is heavily skewed by sales in Greater Vancouver and the GTA, two of Canada’s most active and expensive markets. Excluding these two markets from calculations cuts close to $100,000 from the national average price, trimming it to just under $371,000.

– 30 –

PLEASE NOTE: The information contained in this news release combines both major market and national sales information from MLS® Systems from the previous month. 

CREA cautions that average price information can be useful in establishing trends over time, but does not indicate actual prices in centres comprised of widely divergent neighbourhoods or account for price differential between geographic areas. Statistical information contained in this report includes all housing types. 

MLS® Systems are co-operative marketing systems used only by Canada’s real estate Boards to ensure maximum exposure of properties listed for sale. 

The Canadian Real Estate Association (CREA) is one of Canada’s largest single-industry trade associations, representing more than 125,000 REALTORS® working through some 90 real estate Boards and Associations.

Further information can be found at http://crea.ca/statistics.

For more information, please contact:

Pierre Leduc, Media Relations
The Canadian Real Estate Association
Tel.: 613-237-7111 or 613-884-1460
E-mail: [email protected]

< Back to Newsroom

Canadian home sales improve in January 2019

Ottawa, ON, February 15, 2019 – Statistics released today by the Canadian Real Estate Association (CREA) show national home sales in January 2019 were up from the previous month but remained below levels recorded one year ago.

Highlights:

  • National home sales rose 3.6% between December 2018 and January 2019.
  • Actual (not seasonally adjusted) activity was down by 4% from one year ago.
  • The number of newly listed homes edged up 1% month-over-month in January.
  • The MLS® Home Price Index (HPI) rose 0.8% year-over-year (y-o-y) in January.
  • The national average sale price fell by 5.5% y-o-y in January.

Home sales via Canadian MLS® Systems climbed 3.6% in January 2019 compared to December 2018 (Chart A). The number of homes trading hands was up from the previous month in half of all local markets, led by Montreal, Ottawa and Winnipeg.

Actual (not seasonally adjusted) were down 4% from year-ago levels and turned in the weakest January since 2015. They also came in below the 10-year average for the month on a national basis and in Canada’s three westernmost provinces, Ontario and Newfoundland & Labrador.

“Homebuyers are still adapting to tightened mortgage regulations brought in last year, “said CREA President Barb Sukkau. “However, their impact on homebuyers varies by location, housing type and price segment. All real estate is local. A professional REALTOR® remains your best source for information and guidance in negotiating the purchase or sale of a home during these changing times,” added Sukkau.

“Sales, market balance and home price trends are out of synch among major Canadian cities that have the greatest impact on national results,” said Gregory Klump, CREA’s Chief Economist. “It’s clear that housing market conditions remain weaker in the Prairie region and the Lower Mainland of British Columbia. Notwithstanding the intended consequences, tighter mortgage regulations that took effect in 2018 combined with previous tightening will weigh on economic growth this year.”

The number of newly listed homes edged up 1% in January, led by a jump in new supply in Greater Vancouver and Hamilton-Burlington.

With sales up by more than new listings, the national sales-to-new listings ratio tightened to 56.7% compared to 55.3% posted in December. This measure of market balance has remained close to its long-term average of 53.5% for the last year.

Considering the degree and duration to which market balance readings are above or below their long-term averages is the best way of gauging whether local housing market conditions favour buyers or sellers. Market balance measures that are within one standard deviation of their long-term average are generally consistent with balanced market conditions.

Based on a comparison of the sales-to-new listings ratio with the long-term average, more than half of all local markets were in balanced market territory in January 2019.

The number of months of inventory is another important measure for the balance between sales and the supply of listings. It represents how long it would take to liquidate current inventories at the current rate of sales activity.

There were 5.3 months of inventory on a national basis at the end of January 2019, in line with its long-term average. That said, the well-balanced national reading masks significant regional differences. The number of months of inventory has swollen far above its long-term average in Prairie provinces and Newfoundland & Labrador; as a result, homebuyers there have an ample choice of listings available for purchase. By contrast, the measure remains well below its long-term average in Ontario and Prince Edward Island, consistent with seller’s market conditions. In other provinces, sales and inventory are more balanced.

The Aggregate Composite MLS® Home Price Index (MLS® HPI) was up 0.8% y-o-y in January 2019 – the smallest increase since June 2018 (Chart B).

Apartment units recorded the largest y-o-y price increase in January (+3.3%), followed by townhouse/row units (+1.5%). By comparison, two-storey single-family home prices were little changed (+0.1%) while one-storey single-family home prices edged down (-1.1%).

Trends continue to vary widely among the 17 housing markets tracked by the MLS® HPI. Results were mixed in British Columbia. Prices were down on a y-o-y basis in Greater Vancouver (-4.5%) and the Fraser Valley (-0.8%). By contrast, prices posted a y-o-y increase of 4.2% in Victoria and were up 9.3% elsewhere on Vancouver Island.

Among Greater Golden Horseshoe housing markets tracked by the index, MLS® HPI benchmark home prices were up from year-ago levels in Guelph (+7.2%), the Niagara Region (+7%), Hamilton-Burlington (+5%), Oakville-Milton (+3.9%) and the GTA (+2.7%). By contrast, home prices in Barrie and District remain below year-ago levels (-2.7%).

Across the Prairies, supply is historically elevated relative to sales, causing benchmark home prices to remain down from year-ago levels in Calgary (-3.9%), Edmonton (-2.9%), Regina (-3.8%) and Saskatoon (-2%). The home pricing environment will likely remain weak in these cities until elevated supply is reduced.

Home prices rose 7.1% y-o-y in Ottawa (led by a 9.5% increase in townhouse/row unit prices), 6.3% in Greater Montreal (led by a 9.2% increase in townhouse/row unit prices) and 1% in Greater Moncton (led by a 15.1% increase in townhouse/row unit prices). (Table 1)

The MLS® HPI provides the best way to gauge price trends, as averages are strongly distorted by changes in the mix of sales activity from one month to the next.

The actual (not seasonally adjusted) national average price for homes sold in January 2019 was

just under $455,000, down 5.5% from the same month in 2018 and marking the biggest year-over-year decline since May 2018.

The national average price is heavily skewed by sales in Greater Vancouver and the GTA, two of Canada’s most active and expensive markets. Excluding these two markets from calculations cuts almost $95,000 from the national average price, trimming it to just over $360,000.

– 30 –

PLEASE NOTE: The information contained in this news release combines both major market and national sales information from MLS® Systems from the previous month. 

CREA cautions that average price information can be useful in establishing trends over time, but does not indicate actual prices in centres comprised of widely divergent neighbourhoods or account for price differential between geographic areas. Statistical information contained in this report includes all housing types. 

MLS® Systems are co-operative marketing systems used only by Canada’s real estate Boards to ensure maximum exposure of properties listed for sale. 

The Canadian Real Estate Association (CREA) is one of Canada’s largest single-industry trade associations, representing more than 125,000 REALTORS® working through some 90 real estate Boards and Associations.

Further information can be found at http://crea.ca/statistics.

For more information, please contact:

Pierre Leduc, Media Relations
The Canadian Real Estate Association
Tel.: 613-237-7111 or 613-884-1460
E-mail: [email protected]

< Back to Newsroom

Canadian home sales fall further in December

Ottawa, ON, January 15, 2019 – Statistics released today by the Canadian Real Estate Association (CREA) show national home sales posted a fourth-straight monthly decline in December 2018.

Highlights:

  • National home sales fell 2.5% from November to December.
  • Actual (not seasonally adjusted) activity was down by 19% from one year ago.
  • The number of newly listed homes was little changed from November to December.
  • The MLS® Home Price Index (HPI) was up 1.6% year-over-year (y-o-y) in December.
  • The national average sale price fell by 4.9% y-o-y in December.

Home sales via Canadian MLS® Systems fell by 2.5% in December 2018 compared to November, capping the weakest annual sales since 2012. Monthly declines in activity since September have fully retrenched its summer rally and returned it near the lowest level since early 2013.

Transactions declined in about 60% of all local markets in December, led by lower activity in Greater Vancouver, Vancouver Island, Ottawa, London & St. Thomas, and Halifax-Dartmouth, together with a regionally diverse mix of other large and medium sized urban centres.

Actual (not seasonally adjusted) activity was down 19% y-o-y in December 2018 and stood almost 12% below the 10-year average for the month of December. Sales were down from year-ago levels in three-quarters of all local markets, led overwhelmingly by the Lower Mainland of British Columbia, the Okanagan Region, Calgary, Edmonton, the Greater Toronto Area and Hamilton-Burlington.

This decline, in part, is due to elevated activity posted in December 2017 as home buyers rushed to purchase in advance of the new federal mortgage stress test that came into effect on January 1, 2018.

“What a difference a year makes,” said CREA President Barb Sukkau. “Sales trends were pushed higher in December 2017 by home buyers rushing to purchase before the new federal mortgage stress-test took effect at the beginning of 2018. Since then, the stress-test has weighed on sales to varying degrees in all Canadian housing markets and it will continue to do so this year. All real estate is local. A professional REALTOR® remains your best source for information and guidance in negotiating the purchase or sale of a home during these changing times,” added Sukkau.

“The Bank of Canada recently said that it expects housing activity will stay ‘soft’ as households ‘adjust to the mortgage stress-test and increases in mortgage rates,’ even as jobs and incomes continue growing,” said Gregory Klump, CREA’s Chief Economist. “Indeed, the Bank’s economic forecast shows it expects housing will undermine economic growth this year as the mortgage stress test has pushed home ownership affordability out of reach for some home buyers,” he added.

The number of newly listed homes remained little changed (+0.2%) from November to December, with declines in close to half of all local markets offset by gains in the remainder.

With sales down and new listings steady in December, the national sales-to-new listings ratio eased to 53.3% compared to 54.8% in November. This measure of market balance has remained close to its long-term average of 53.5% since the beginning of 2018.

Considering the degree and duration to which market balance readings are above or below their long-term averages is the best way of gauging whether local housing market conditions favour buyers or sellers. Market balance measures that are within one standard deviation of their long-term average are generally consistent with balanced market conditions.

Based on a comparison of the sales-to-new listings ratio with the long-term average, about two-thirds of all local markets were in balanced market territory in December 2018.

The number of months of inventory is another important measure for the balance between sales and the supply of listings. It represents how long it would take to liquidate current inventories at the current rate of sales activity.

There were 5.6 months of inventory on a national basis at the end of December 2018. While this remains close to its long-term average of 5.3 months, the number of months of inventory has swollen far above its long-term average in Prairie provinces as well as in Newfoundland & Labrador. By contrast, the measure remains well below its long-term average in Ontario and Prince Edward Island. In other provinces, sales and inventory are more balanced.

The Aggregate Composite MLS® Home Price Index (MLS® HPI) was up 1.6% y-o-y in December 2018. The increase is smaller but still broadly in line with y-o-y gains posted since July. (Chart B)

Apartment units posted the largest y-o-y price gains in December (+4.9%), followed by townhouse/row units (+3.1%). By comparison, two-storey single-family homes posted a small increase (+0.4%) while one-storey single-family home prices eased slightly (-0.3%).

Trends continue to vary widely among the 17 housing markets tracked by the MLS® HPI. Results were mixed in British Columbia. Prices are now down on a y-o-y basis in Greater Vancouver (-2.7%) but remain above year-ago levels in the Fraser Valley (+2.5%). Meanwhile, prices posted a y-o-y increase of 6.4% in Victoria and rose 11% elsewhere on Vancouver Island.

Among housing markets tracked by the index in the Greater Golden Horseshoe region, MLS® HPI benchmark home prices were up from year-ago levels in Guelph (+6.8%), the Niagara Region (+6.8%), Hamilton-Burlington (+6.4%), Oakville-Milton (+3.3%) and the GTA (+3%). Home prices in Barrie and District remain slightly below year-ago levels (-1.1%).

Across the Prairies where supply is historically elevated relative to sales, benchmark home prices remained below year-ago levels in Calgary (-3.2%), Edmonton (-2%), Regina (-5.2%) and Saskatoon (-1.2%). The home pricing environment is likely to remain weak in these housing markets until elevated supply is reduced and becomes more balanced in relation to demand.

Home prices rose 6.9% y-o-y in Ottawa (led by an 8.3% increase in townhouse/row unit prices), 6% in Greater Montreal (led by a 9.1% increase in townhouse/row unit prices) and 2.5% in Greater Moncton (led by a 12.2% increase in townhouse/row unit prices). (Table 1)

The MLS® HPI provides the best way to gauge price trends because average price trends are strongly distorted by changes in the mix of sales activity from one month to the next.

The actual (not seasonally adjusted) national average price for homes sold in December 2018 was just over $472,000, down 4.9% from the same month in 2017. The y-o-y decline reflects how the jump in sales in December 2017 in advance of the stress test was more pronounced in more expensive markets.

The national average price is heavily skewed by sales in Greater Vancouver and the GTA, two of Canada’s most active and expensive markets. Excluding these two markets from calculations cuts almost $100,000 from the national average price, trimming it to just under $375,000.

– 30 –

PLEASE NOTE: The information contained in this news release combines both major market and national sales information from MLS® Systems from the previous month. 

CREA cautions that average price information can be useful in establishing trends over time, but does not indicate actual prices in centres comprised of widely divergent neighbourhoods or account for price differential between geographic areas. Statistical information contained in this report includes all housing types. 

MLS® Systems are co-operative marketing systems used only by Canada’s real estate Boards to ensure maximum exposure of properties listed for sale. 

The Canadian Real Estate Association (CREA) is one of Canada’s largest single-industry trade associations, representing more than 125,000 REALTORS® working through some 90 real estate Boards and Associations.

Further information can be found at http://crea.ca/statistics.

For more information, please contact:

Pierre Leduc, Media Relations
The Canadian Real Estate Association
Tel.: 613-237-7111 or 613-884-1460
E-mail: [email protected]

< Back to Newsroom

Canadian home sales activity softens further in November

Ottawa, ON, December 17, 2018 – Statistics released today by the Canadian Real Estate Association (CREA) show national home sales posted another monthly decline in November 2018.

Highlights:

  • National home sales fell 2.3% from October to November.
  • Actual (not seasonally adjusted) activity was down by 12.6% from one year ago.
  • The number of newly listed homes declined by 3.3% from October to November.
  • The MLS® Home Price Index (HPI) was up 2% year-over-year (y-o-y) in November.
  • The national average sale price retreated by 2.9% y-o-y in November.

Home sales via Canadian MLS® Systems fell by 2.3% in November 2018, adding to the decline in October of 1.7%. While the number of homes trading hands is still up from its low point in the spring, it remains below monthly levels posted from 2014 through 2017. (Chart A)

Transactions declined in just over half of all local markets, with lower activity in the Greater Toronto Area (GTA), the Greater Vancouver Area (GVA) and Hamilton-Burlington offsetting increased sales in Edmonton.

Actual (not seasonally adjusted) activity was down 12.6% y-o-y and came in below the 10-year average for the month of November. Sales were down from year-ago levels in three-quarters of all local markets, including the Lower Mainland of British Columbia, Calgary, the GTA and Hamilton-Burlington.

“National sales activity has lost a bit of momentum over the past couple of months, but local market trends can be, and very often are, different by comparison,” said CREA President Barb Sukkau. “All real estate is local. A professional REALTOR® remains your best source for information and guidance in negotiating the purchase or sale of a home during these changing times,” added Sukkau.

“The decline in homeownership affordability caused by this year’s new mortgage stress-test remains very much in evidence,” said Gregory Klump, CREA’s Chief Economist. “Despite supportive economic and demographic fundamentals, national home sales have begun trending lower. While national home sales were anticipated to recover in the wake of a large drop in activity earlier this year due to the introduction of the stress-test, the rebound appears to have run its course.”

The number of newly listed homes fell by 3.3% between October and November, with new supply declining in roughly 70% of all local markets.

With new listings having declined by more than sales in November, the national sales-to-new listings ratio tightened slightly to 54.8% compared to 54.2% in October. This measure of market balance has remained close to its long-term average of 53.4% since the beginning of 2018.

Considering the degree and duration to which market balance readings are above or below their long-term averages is the best way of gauging whether local housing market conditions favour buyers or sellers. Market balance measures that are within one standard deviation of their long-term average are generally consistent with balanced market conditions.

Based on a comparison of the sales-to-new listings ratio with the long-term average, about 60% of all local markets were in balanced market territory in November 2018.

The number of months of inventory is another important measure for the balance between sales and the supply of listings. It represents how long it would take to liquidate current inventories at the current rate of sales activity.

There were 5.4 months of inventory on a national basis at the end of November 2018. While this remains in line with its long-term average of 5.3 months, the number of months of inventory is well above its long-term average in the Prairie provinces as well as in Newfoundland & Labrador. By contrast, the measure is well below its long-term average in Ontario, New Brunswick and Prince Edward Island. In other provinces, sales and inventory are more balanced.

The Aggregate Composite MLS® Home Price Index (MLS® HPI) was up 2% y-o-y in November 2018. The increase is similar to gains posted since July. (Chart B)

Apartment units posted the largest y-o-y price gains in November (+6%), followed by townhouse/row units (+4%). By comparison, one-storey single-family homes posted a modest increase (+0.4%) while two-storey single-family home prices held steady (+0.1%).

Trends continue to vary widely among the 17 housing markets tracked by the MLS® HPI. In British Columbia, home price gains have been steadily diminishing on a y-o-y basis in the Fraser Valley (+4.7%) and Victoria (+7.2%). By contrast, price gains picked up elsewhere on Vancouver Island (+12.6%) and, for the first time in five years, were down (-1.4%) from year-ago levels in the GVA.

Among housing markets tracked by the index in the Greater Golden Horseshoe region, MLS® HPI benchmark home prices were up from year-ago levels in Guelph (+9.3%), the Niagara Region (+7.2%), Hamilton-Burlington (+6.3%), Oakville-Milton (+3.4%) and the GTA (+2.7%). Meanwhile, home prices in Barrie and District remain below year-ago levels (-2.1%).

Across the Prairies, benchmark home prices remained below year-ago levels in Calgary (-2.9%), Edmonton (-1.9%), Regina (-4%) and Saskatoon (-0.3%). Amid elevated supply relative to sales, the home pricing environment will remain weak in these housing markets until they become better balanced.

Home prices rose 6.6% y-o-y in Ottawa (led by a 7.3% increase in two-storey single-family home prices), 6.2% in Greater Montreal (led by a 9.4% increase in townhouse/row unit prices) and 4.2% in Greater Moncton (led by an 11.2% increase in townhouse/row unit prices). (Table 1)

The MLS® HPI provides the best way to gauge price trends because average price trends are strongly distorted by changes in the mix of sales activity from one month to the next.

The actual (not seasonally adjusted) national average price for homes sold in November 2018 was just over $488,000, down 2.9% from the same month last year.

The national average price is heavily skewed by sales in Greater Vancouver and the GTA, two of Canada’s most active and expensive markets. Excluding these two markets from calculations cuts almost $110,000 from the national average price, trimming it to just over $378,000.

– 30 –

PLEASE NOTE: The information contained in this news release combines both major market and national sales information from MLS® Systems from the previous month. 

CREA cautions that average price information can be useful in establishing trends over time, but does not indicate actual prices in centres comprised of widely divergent neighbourhoods or account for price differential between geographic areas. Statistical information contained in this report includes all housing types. 

MLS® Systems are co-operative marketing systems used only by Canada’s real estate Boards to ensure maximum exposure of properties listed for sale. 

The Canadian Real Estate Association (CREA) is one of Canada’s largest single-industry trade associations, representing more than 125,000 REALTORS® working through some 90 real estate Boards and Associations.

Further information can be found at http://crea.ca/statistics.

For more information, please contact:

Pierre Leduc, Media Relations
The Canadian Real Estate Association
Tel.: 613-237-7111 or 613-884-1460
E-mail: [email protected]

< Back to Newsroom